Fig. 8.
Download original image
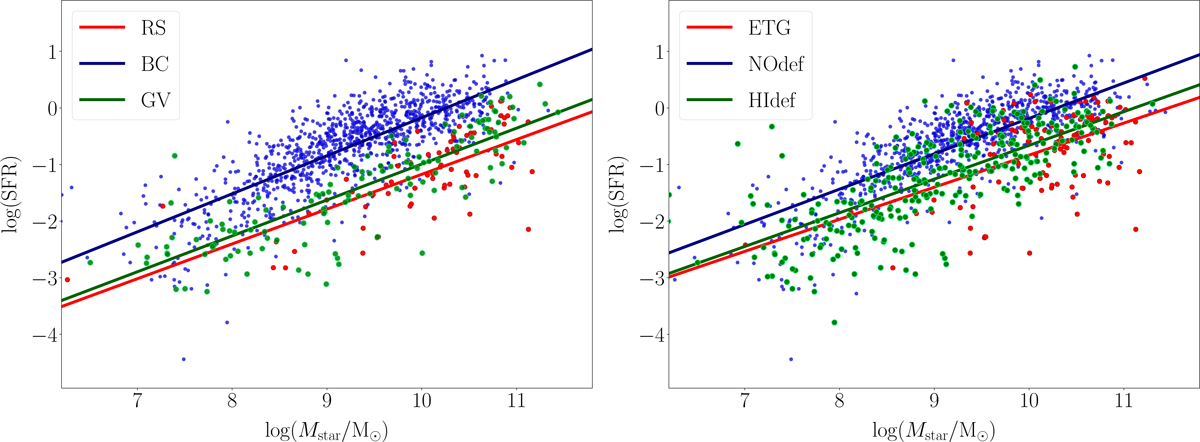
Main-sequence relation of galaxies in the Spring catalogue. Left: Sample divided according to the chromatic criterion of Boselli et al. (2014; see Fig. 2 therein), showing whether they belong to the RS, the GV, or the BC. For each class, the linear regression analysis is given. Right: Same relation for the sub-sample of ETGs with detailed morphological classifications available (red), and of deficient (H I > 0.4, green) and non-deficient galaxies (H I ≤ 0.4, blue). The slopes of the linear regressions for the ETGs and the H I-deficiency classes are consistent with the ones corresponding to the three chromatic classes.
Current usage metrics show cumulative count of Article Views (full-text article views including HTML views, PDF and ePub downloads, according to the available data) and Abstracts Views on Vision4Press platform.
Data correspond to usage on the plateform after 2015. The current usage metrics is available 48-96 hours after online publication and is updated daily on week days.
Initial download of the metrics may take a while.