Fig. 6.
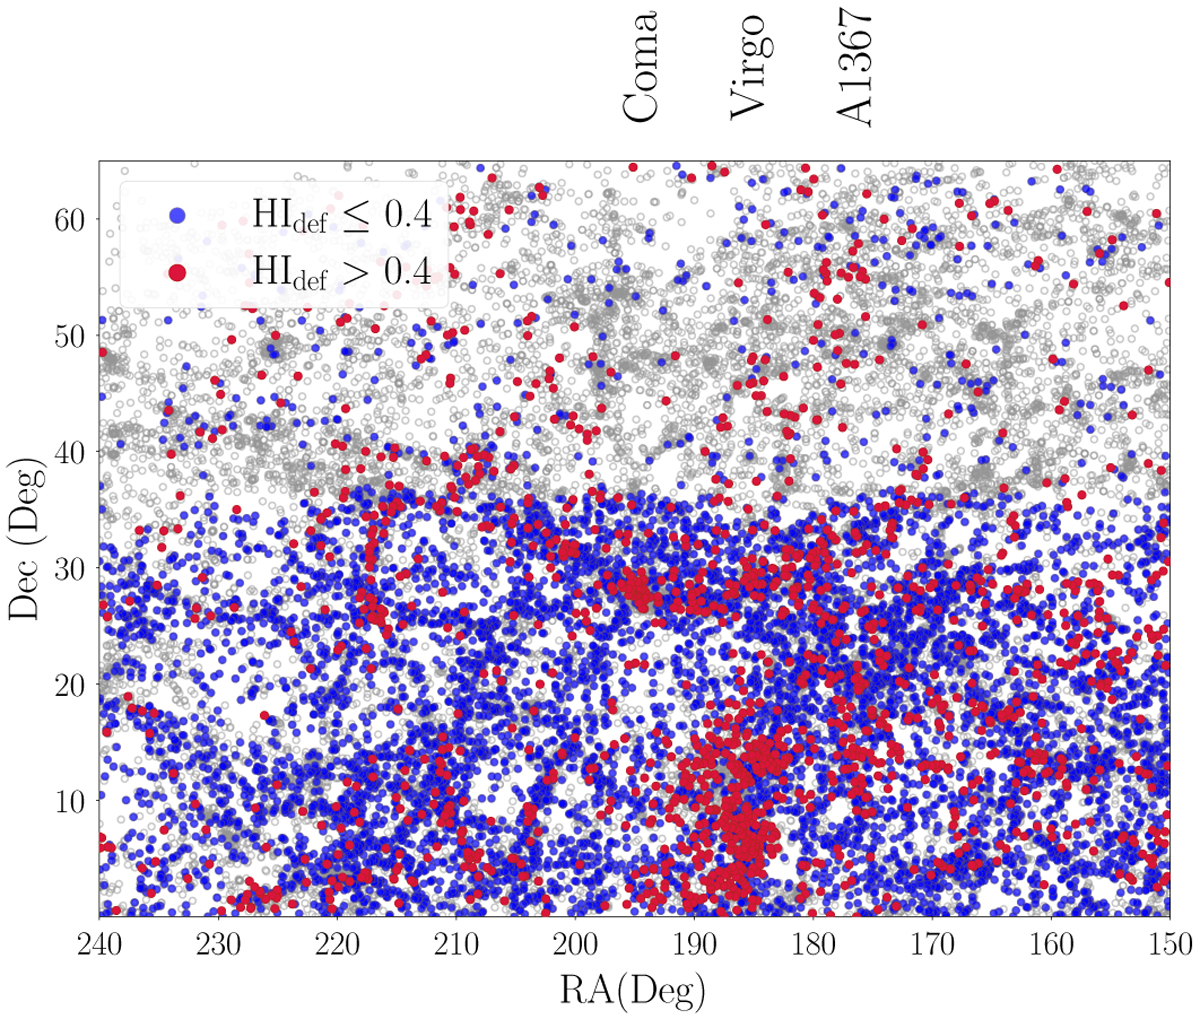
Download original image
Sky distribution of galaxies in the SPRING sample in classes of the HI-deficiency parameter. The horizontal line at Dec = 36 deg traces the limiting pointing declination of the Arecibo dish. Grey circles stand for galaxies for which the H I content is unknown. Blue dots denote galaxies with H Idef ≤ 0.4, while red dots are for galaxies with H Idef > 0.4. The latter class is distributed consistently around (in) the Coma cluster and the Virgo cluster, with a small number of entries belonging to the A1367 cluster. It is noticeable that our knowledge of the H I properties of local galaxies in such an extended stretch of the sky depends on the availability of Arecibo data, which are limited to declination ≲ 36°.
Current usage metrics show cumulative count of Article Views (full-text article views including HTML views, PDF and ePub downloads, according to the available data) and Abstracts Views on Vision4Press platform.
Data correspond to usage on the plateform after 2015. The current usage metrics is available 48-96 hours after online publication and is updated daily on week days.
Initial download of the metrics may take a while.