Open Access
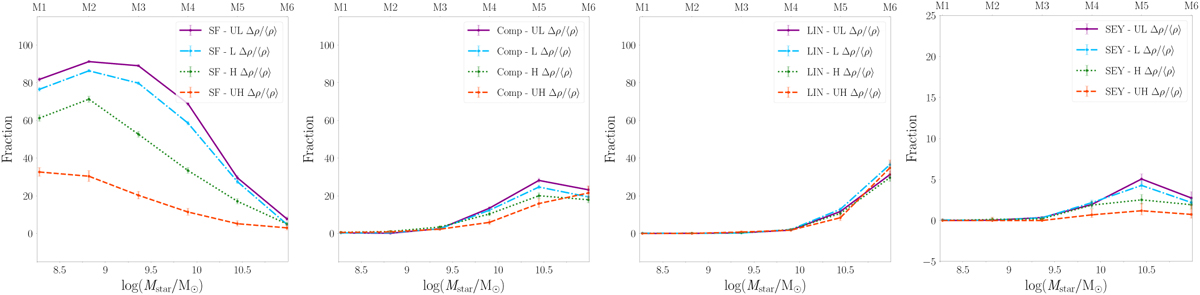
Fig. 18.
Download original image
Baldwin-Phillips-Terlevich-computed frequencies of SF, SEY, LIN and Comp as a function of log(Mstar/M⊙) (represented by the six bins M1, ..., M6) in the four overdensity bins defined in Sect. 2.3.1. The y-axis scale in the right panel (SEY) is magnified to highlight the differences between the four overdensity classes.
Current usage metrics show cumulative count of Article Views (full-text article views including HTML views, PDF and ePub downloads, according to the available data) and Abstracts Views on Vision4Press platform.
Data correspond to usage on the plateform after 2015. The current usage metrics is available 48-96 hours after online publication and is updated daily on week days.
Initial download of the metrics may take a while.