Open Access
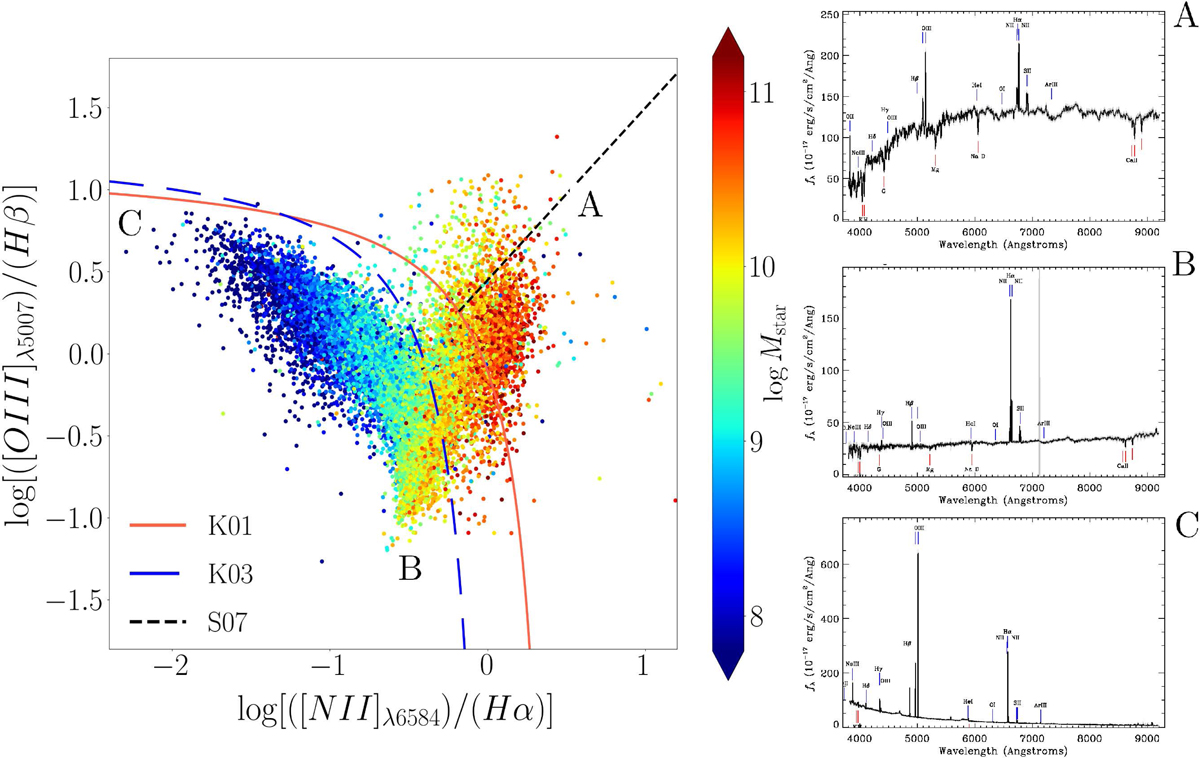
Fig. 15.
Download original image
Baldwin-Phillips-Terlevich diagnostic diagrams for galaxies in the SPRING catalogue. Three examples of spectra are given. Colours provide the logarithm of Mstar in solar-mass units.
Current usage metrics show cumulative count of Article Views (full-text article views including HTML views, PDF and ePub downloads, according to the available data) and Abstracts Views on Vision4Press platform.
Data correspond to usage on the plateform after 2015. The current usage metrics is available 48-96 hours after online publication and is updated daily on week days.
Initial download of the metrics may take a while.