Fig. 14.
Download original image
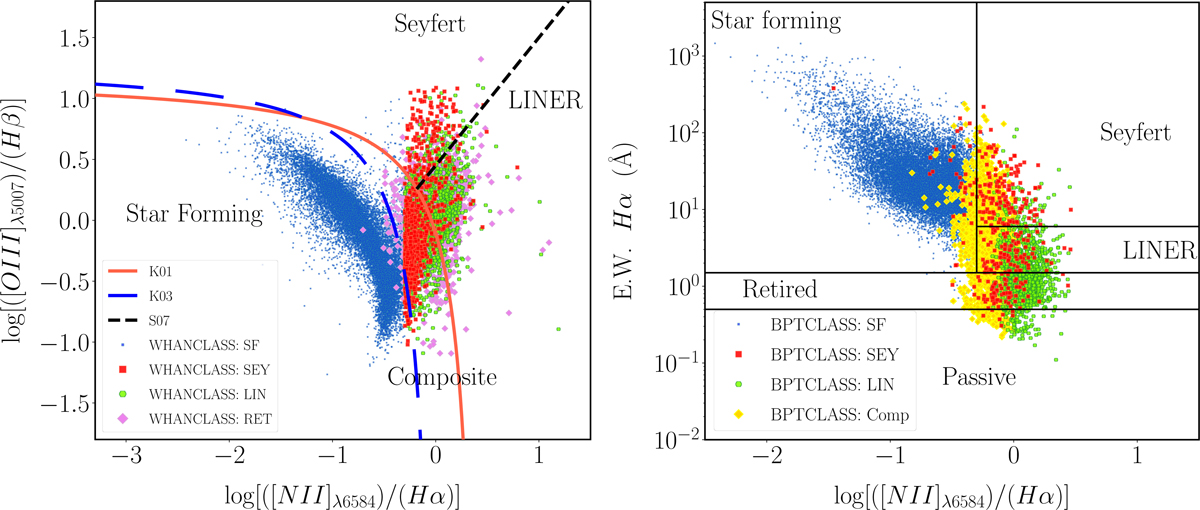
Visual comparison between the two optical emission-line diagnostics used in this work. Left: Baldwin-Phillips-Terlevich diagram of galaxies grouped according to their WHAN classification (blue=SF, red==SEY, green=LIN, violet=RET). Right: EWHα versus [NII]/Hα diagram of galaxies grouped according to their BPT classification (blue=SF, red==SEY, green=LIN, yellow=Comp).
Current usage metrics show cumulative count of Article Views (full-text article views including HTML views, PDF and ePub downloads, according to the available data) and Abstracts Views on Vision4Press platform.
Data correspond to usage on the plateform after 2015. The current usage metrics is available 48-96 hours after online publication and is updated daily on week days.
Initial download of the metrics may take a while.