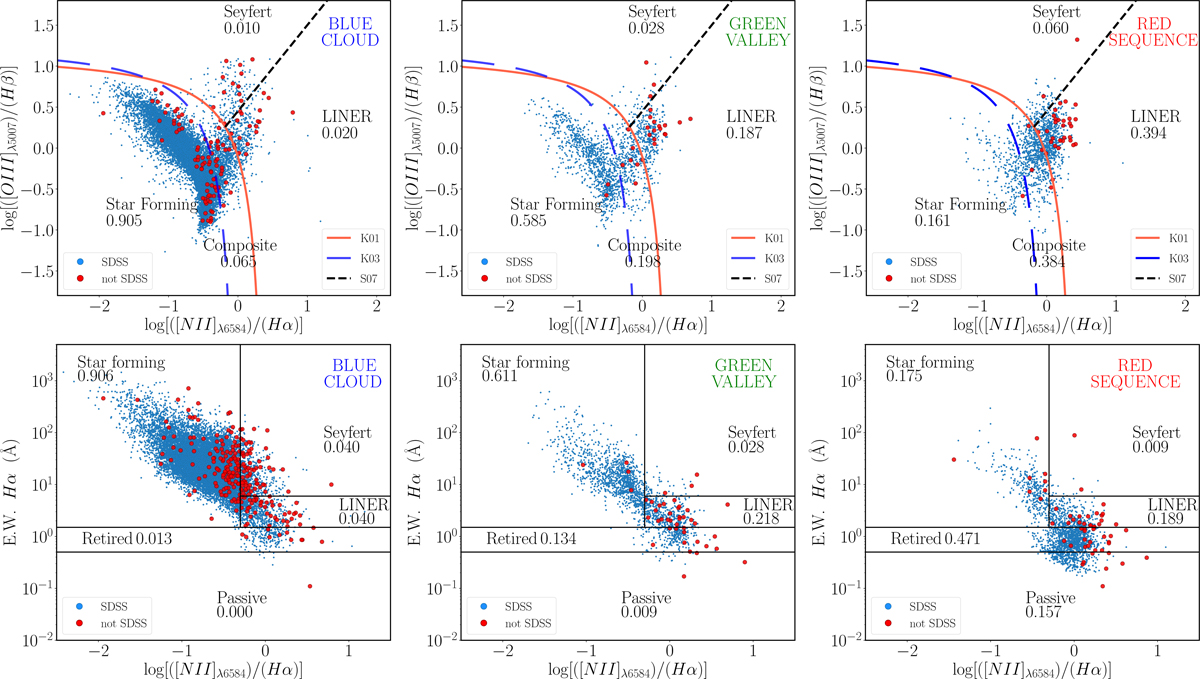
Fig. 13.
Download original image
Optical emission-line diagnostics for galaxies in the Spring catalogue. Top row: Baldwin-Phillips-Terlevich diagnostic diagram for galactic nuclei in the blue cloud, green valley, and red sequence (left, centre, and right respectively). The SDSS galaxies are given with blue points. Measurements from other sources are given with larger red dots. The associated percentage of galaxies is given for each spectral category. The red straight line represents the model of Kewley et al. (2001) to identify AGN. The long-dashed blue line gives the model of Kauffmann & Haehnelt (2000) above which AGN are found. Composite nuclei fall between these two models. The dashed black line (Schawinski et al. 2007) separates Seyfert galaxies from LINERs. Bottom row: EWHα versus [NII]/Hα diagram diagnostic diagram for galactic nuclei in the blue cloud, green valley, and red sequence (left, centre, and right respectively). The SDSS galaxies are given with blue points. Measurements from other sources are given with larger red dots. The associated percentage of galaxies is given for each spectral category.
Current usage metrics show cumulative count of Article Views (full-text article views including HTML views, PDF and ePub downloads, according to the available data) and Abstracts Views on Vision4Press platform.
Data correspond to usage on the plateform after 2015. The current usage metrics is available 48-96 hours after online publication and is updated daily on week days.
Initial download of the metrics may take a while.