Fig. 1.
Download original image
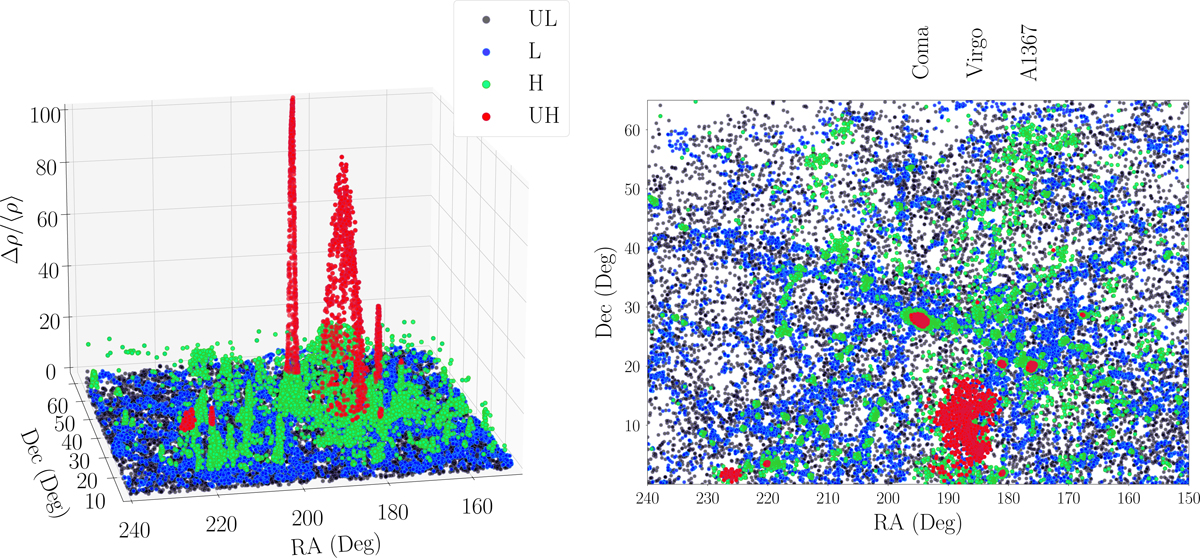
Celestial distribution of the 30 597 galaxies analysed in the SPRING catalogue, distributed over nearly one-fourth of the northern sky. They represent the totality of galaxies in the spring sky within cz < 10 000 km s−1 and r < 17.7 mag. The colours represent the overdensity parameter Δρ/⟨ρ⟩ (defined in Sect. 2.3.1) for galaxies in four bins of local galaxy overdensity (red = UH, green = H, blue = L, black = UL). In the left panel, the third dimension emphasises the overdensity parameter. The highest narrow peak represents the Coma cluster, the second narrow peak is A1367, and the broader peak is Virgo.
Current usage metrics show cumulative count of Article Views (full-text article views including HTML views, PDF and ePub downloads, according to the available data) and Abstracts Views on Vision4Press platform.
Data correspond to usage on the plateform after 2015. The current usage metrics is available 48-96 hours after online publication and is updated daily on week days.
Initial download of the metrics may take a while.