Open Access
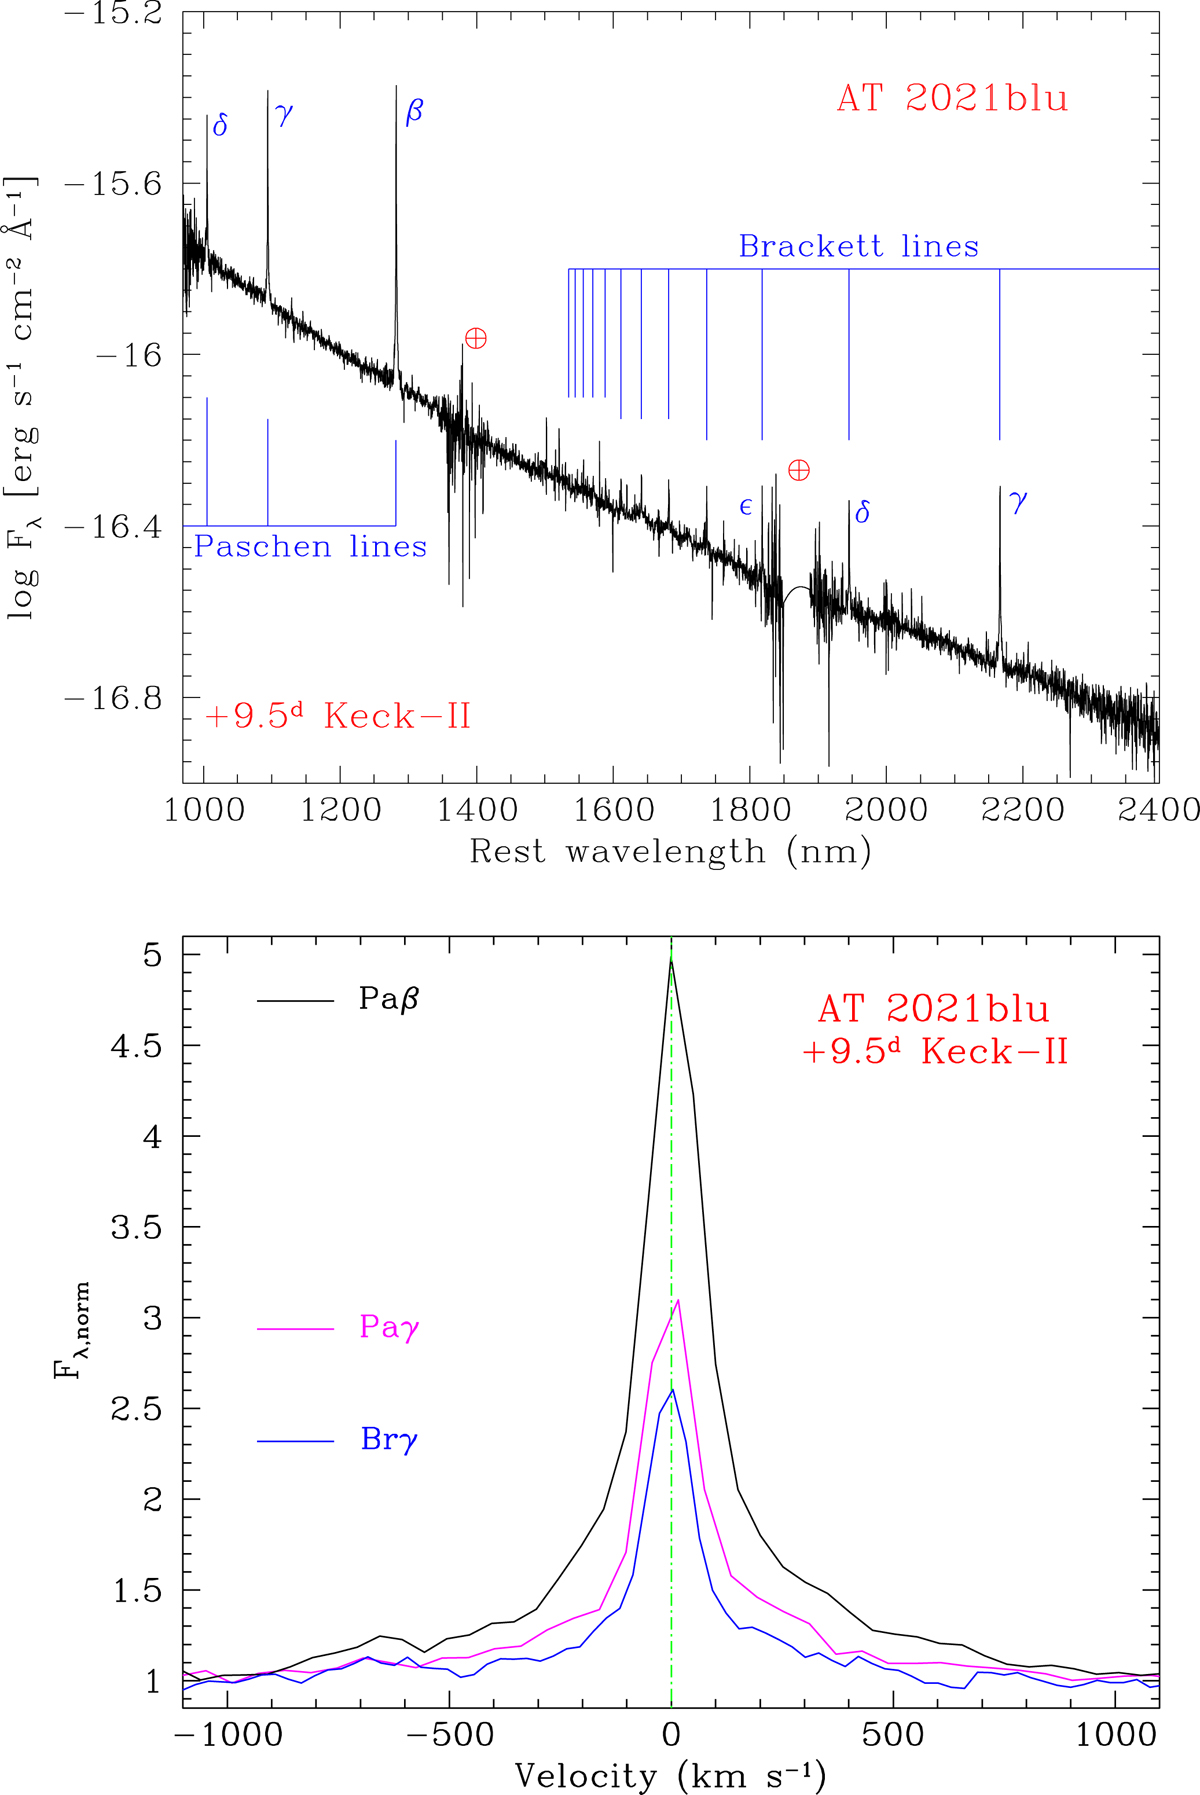
Fig. 16.
Download original image
NIR spectroscopy of AT 2021blu. Top panel: line identification in the NIR spectrum of AT 2021blu taken about 10 d after maximum brightness with the Keck-II telescope equipped with NIRES. Bottom panel: profile of the main H lines in the NIR domain. The spectrum has been normalised to the flux level of the continuum.
Current usage metrics show cumulative count of Article Views (full-text article views including HTML views, PDF and ePub downloads, according to the available data) and Abstracts Views on Vision4Press platform.
Data correspond to usage on the plateform after 2015. The current usage metrics is available 48-96 hours after online publication and is updated daily on week days.
Initial download of the metrics may take a while.