Fig. 15.
Download original image
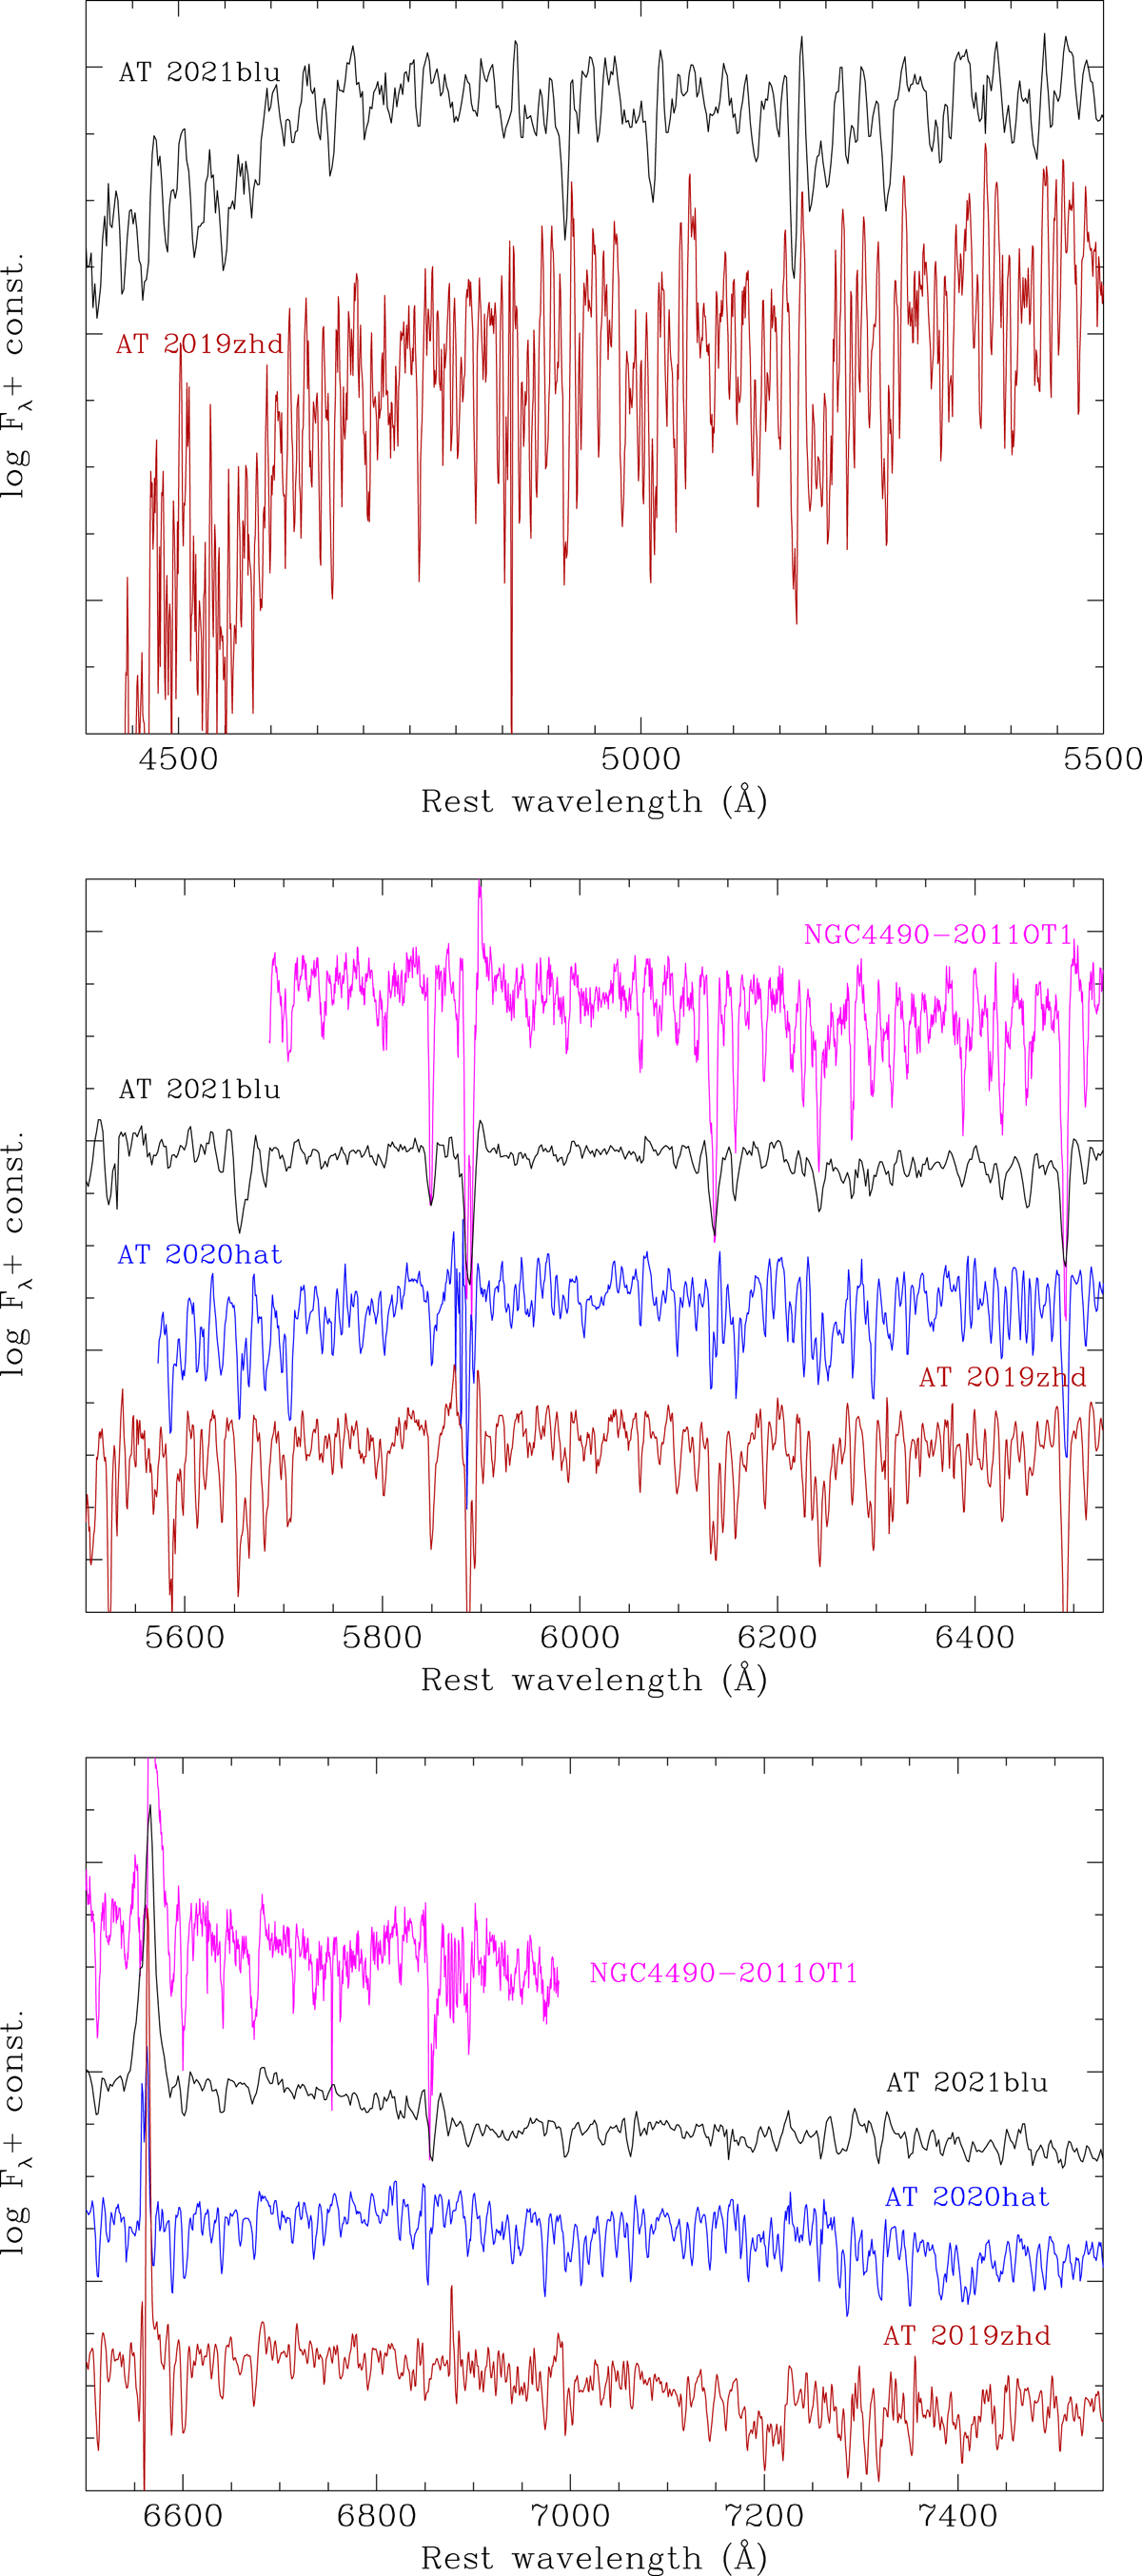
Comparison between medium resolution spectra of AT 2021blu, NGC4490-2011OT1 (Smith et al. 2016), AT 2020hat (Pastorello et al. 2021a), and AT 2019zhd (Pastorello 2021b) obtained during the plateau or the red peak phase. Top panel: close-up view of the region between 4400 and 5500 Å. Middle panel: view of the region from 5500 to 6500 Å. Bottom panel: View of the region from 6500 to 7570 Å. Despite the objects are different, most of narrow metal lines are observed in all the spectra.
Current usage metrics show cumulative count of Article Views (full-text article views including HTML views, PDF and ePub downloads, according to the available data) and Abstracts Views on Vision4Press platform.
Data correspond to usage on the plateform after 2015. The current usage metrics is available 48-96 hours after online publication and is updated daily on week days.
Initial download of the metrics may take a while.