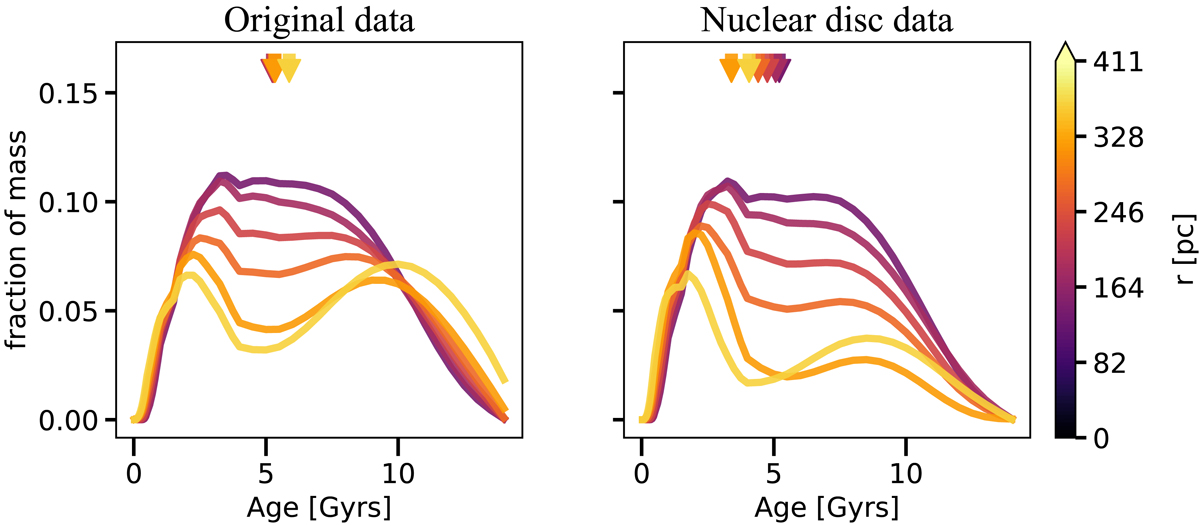
Fig. 8.
Download original image
SFHs for NGC 1433 in different galactocentric radii for the original data (left) and the ND data (right). In the y-axis we display the fraction of mass formed. In the upper part of each panel we use arrows to display the mean age for each SFH, following the same colour coding with respect to the distance to the centre. For both data cubes, it is clear that the farther from the centre, the younger the SFH is (with the exception of the last curve), meaning that the fraction of younger stars increases. This is shown even more strikingly with the subtracted data cube: it is clear that the outskirts of the ND are in fact younger, in accordance with the inside-out growth scenario of Bittner et al. (2019).
Current usage metrics show cumulative count of Article Views (full-text article views including HTML views, PDF and ePub downloads, according to the available data) and Abstracts Views on Vision4Press platform.
Data correspond to usage on the plateform after 2015. The current usage metrics is available 48-96 hours after online publication and is updated daily on week days.
Initial download of the metrics may take a while.