Fig. 7.
Download original image
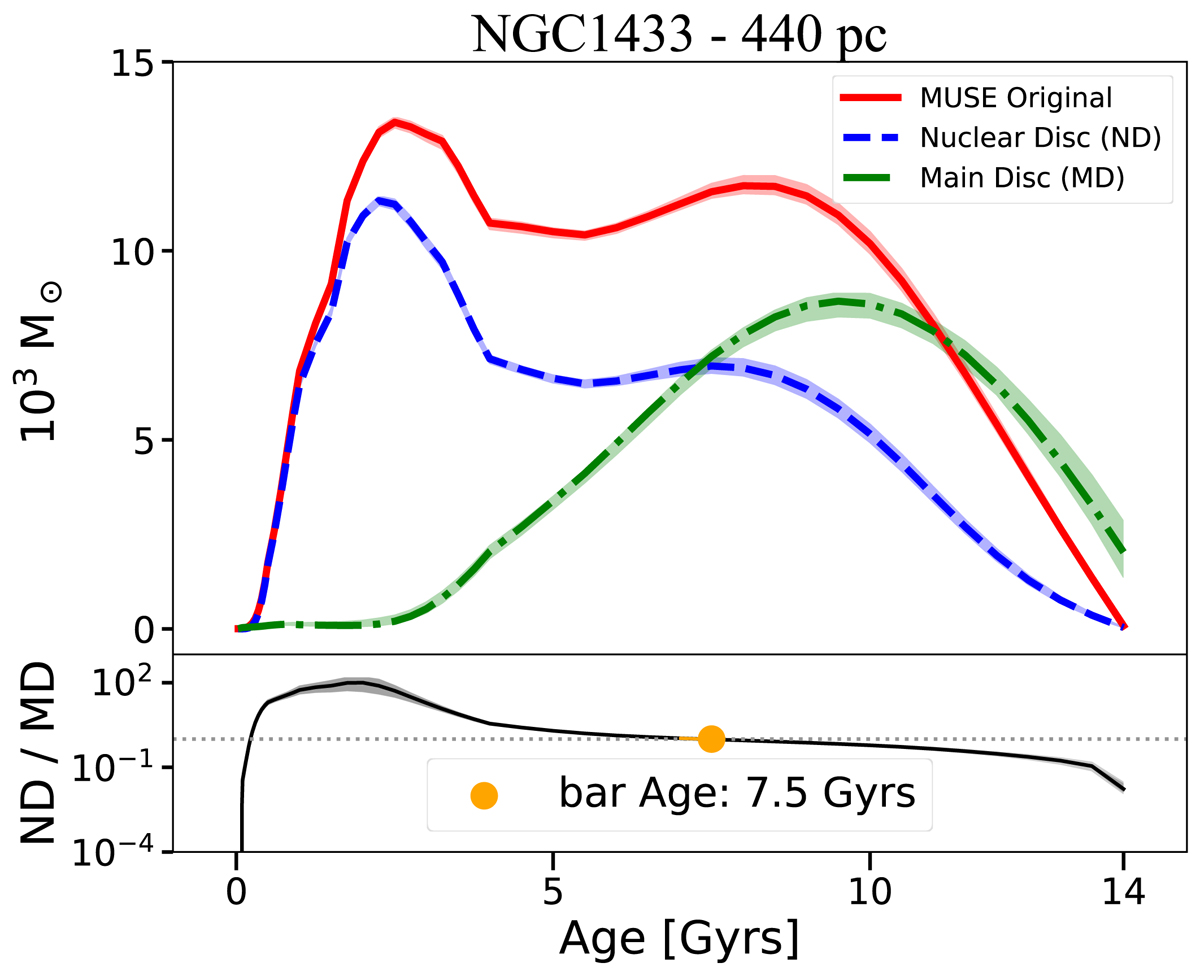
Mass-weighted SFHs for NGC 1433 from collapsed spectra of the MUSE original data, ND data, and representative MD data, as illustrated in Fig. 2. The y-axis corresponds to the mass formed, in solar masses, for each age bin and the x-axis to the age in Gyr, that is, the look-back time. The original data are shown with a solid red line, the subtracted data with a dashed blue line, and the representative spectrum with the dot-dashed green line. The lines are the SFHs derived from the data, while the shaded regions are results from 100 Monte Carlo runs. In the bottom panel we display ND/MD in black, and highlighted with an orange circle is the age where ND/MD rises above one for the first time, together with the statistical uncertainty: ![]() Gyr.
Gyr.
Current usage metrics show cumulative count of Article Views (full-text article views including HTML views, PDF and ePub downloads, according to the available data) and Abstracts Views on Vision4Press platform.
Data correspond to usage on the plateform after 2015. The current usage metrics is available 48-96 hours after online publication and is updated daily on week days.
Initial download of the metrics may take a while.