Fig. 6.
Download original image
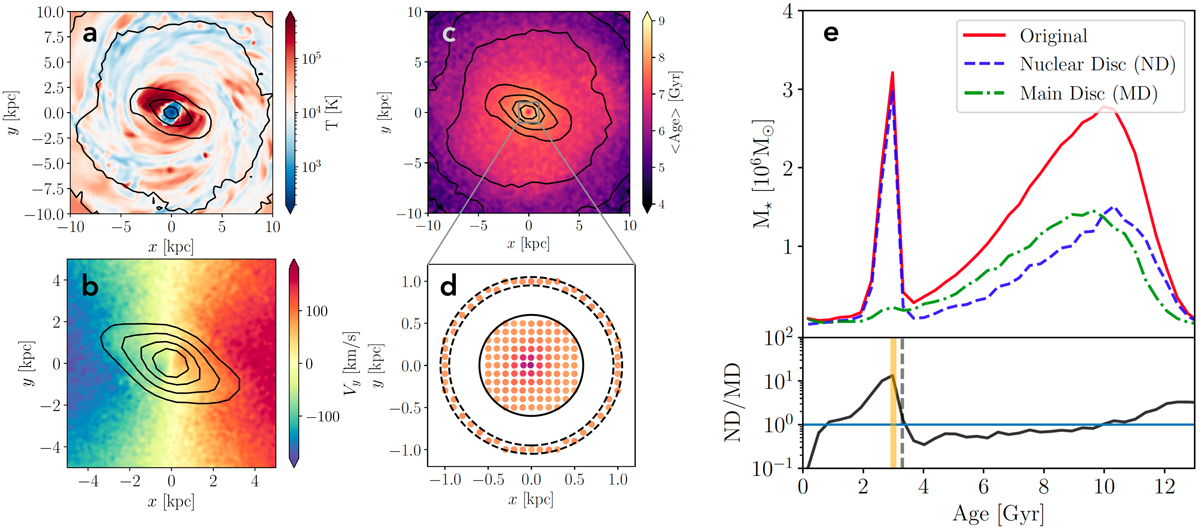
Testing the methodology using hydrodynamic simulations. a: face-on projection of the gas temperature. The dust lanes on the leading edge of the bar and the gaseous ND are clearly visible as low temperature regions. b: kinematic map showing the velocity of stars in the y direction with stellar isodensity contours over plotted, which outline the shape of the bar (note the different scale compared to panel a). A highly rotating stellar component in the central kiloparsec (i.e. the ND) is clearly evident in the kinematic map. c: age map of all the stars in the simulated galaxy. The grey box shows the inset that is represented in panel d. d: zoomed-in view around the ND region. The inner and outer dashed lines denote the region used to obtain the SFH of the ‘representative disc region’. The solid black line denotes the radius within which the SFH of the ND is estimated. The scatter points indicate the locations of the pixels used for deriving the SFHs in panel e. The points are colour-coded by the mean age in the pixel. e: the top panel shows the SFHs of the original ND region (solid red), of the representative SFH of the MD (dot-dashed green), and of the ND with the representative SFH subtracted (dashed blue). The bottom panel shows the ratio of the subtracted SFH to the representative SFH. The vertical orange line indicates the time of bar formation in the simulation (3 Gyr), and the vertical dashed line indicates the time at which ND/MD is above 1 (3.3 Gyr).
Current usage metrics show cumulative count of Article Views (full-text article views including HTML views, PDF and ePub downloads, according to the available data) and Abstracts Views on Vision4Press platform.
Data correspond to usage on the plateform after 2015. The current usage metrics is available 48-96 hours after online publication and is updated daily on week days.
Initial download of the metrics may take a while.