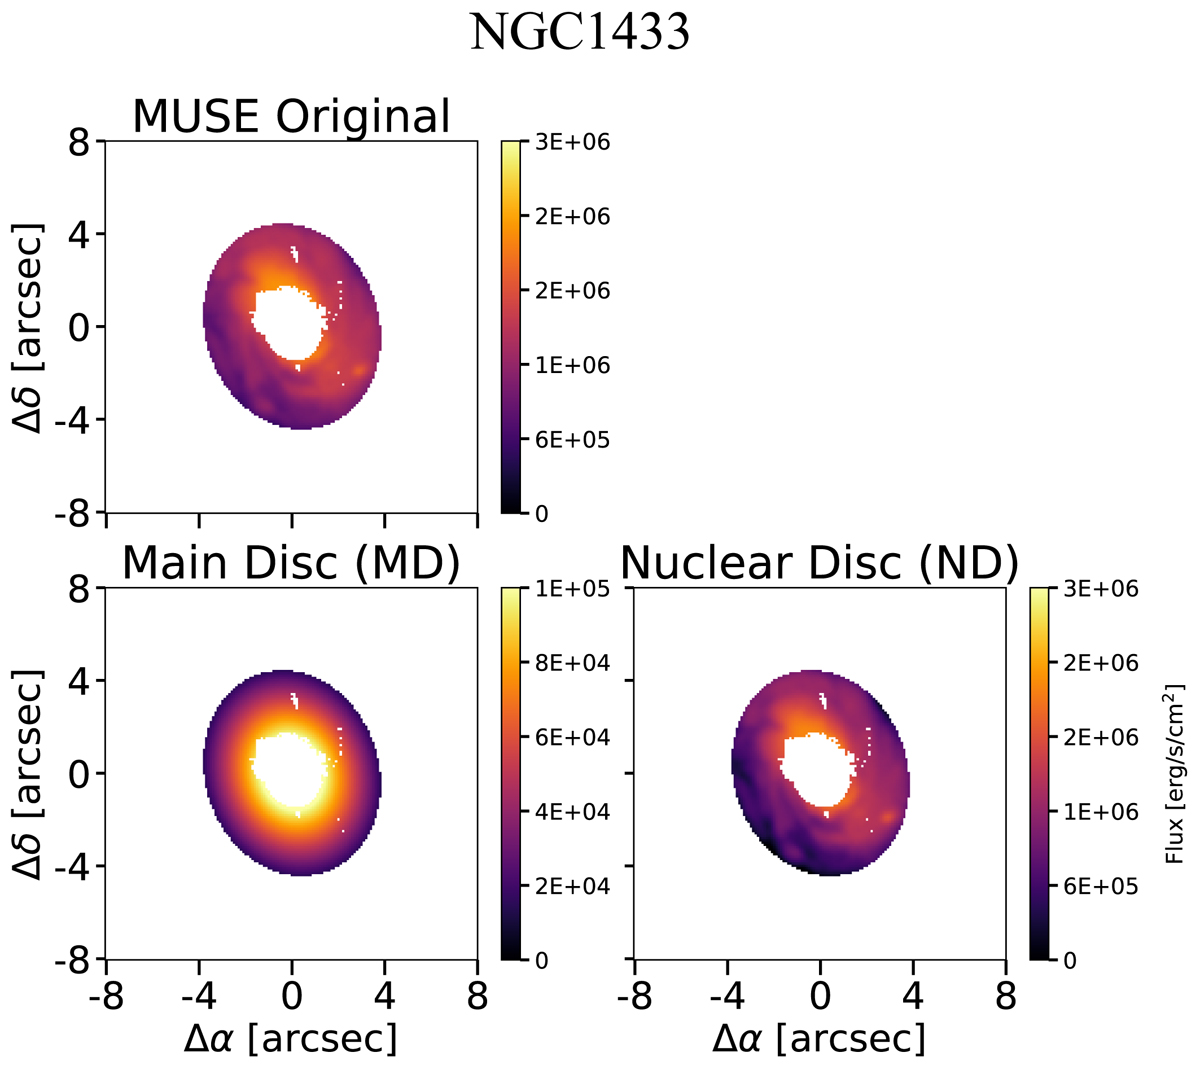
Fig. 5.
Download original image
Illustration of different data products derived from the methodology described in Sect. 3. We display the sum of the original MUSE fluxes between 4800 and 5800 Å (top row), and the derived representative MD (bottom row, left) and the ND data (bottom row, right), which is the result of subtracting the representative MD from the original data cube. For the representative MD, it is possible to notice the exponential increase in flux towards the centre. All data cubes were masked for AGN contributions with AON ≥ 20.
Current usage metrics show cumulative count of Article Views (full-text article views including HTML views, PDF and ePub downloads, according to the available data) and Abstracts Views on Vision4Press platform.
Data correspond to usage on the plateform after 2015. The current usage metrics is available 48-96 hours after online publication and is updated daily on week days.
Initial download of the metrics may take a while.