Fig. 2.
Download original image
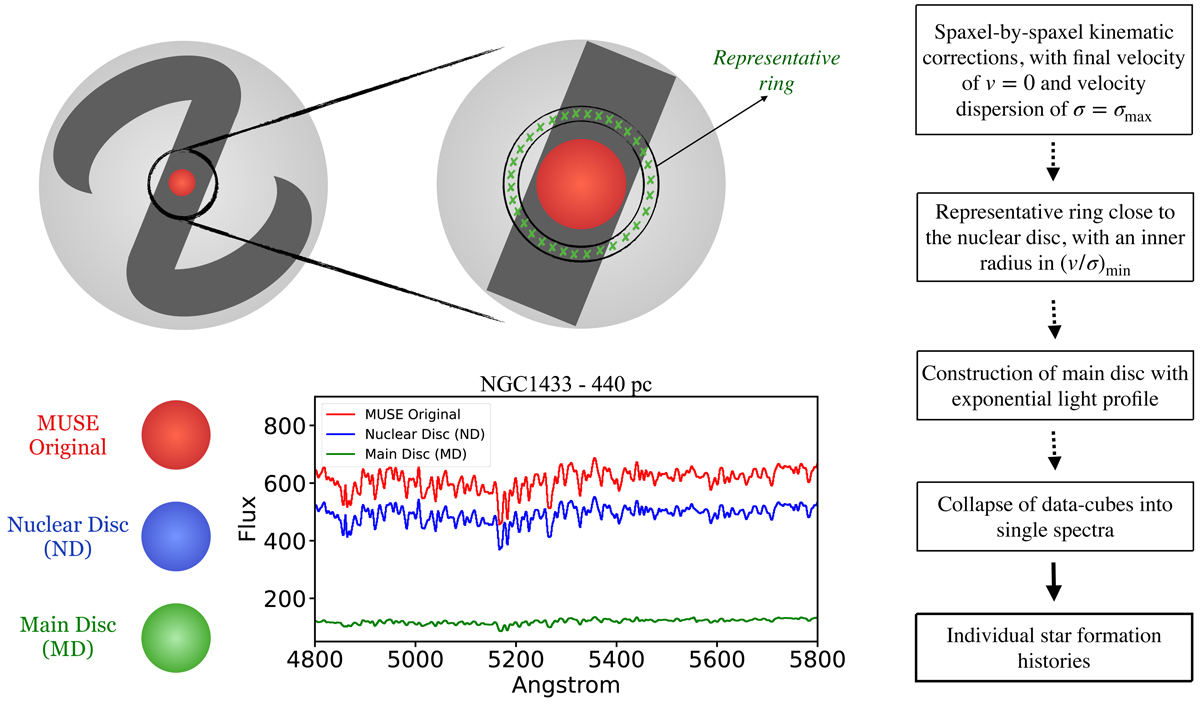
Illustration of the methodology described in Sect. 3 for a galaxy that hosts a ND. In the top left we highlight the field of view from MUSE in the centre of the galaxy and the position of the representative region just outside the ND. The position of the representative ring is chosen taking the v/σ radial profile into consideration. From it we derive the representative spectrum used to build the MD. In the bottom left we display the output from the light disentangling: the original data cube (red), the ND data cube (blue), and the representative MD data cube (green). All three data cubes have spaxels corrected to v = 0 km s−1 and σ = σmax km s−1. Lastly, we collapse each data cube into a mean spectrum (as illustrated) and derive SFHs for each one. The steps in our methodology are described to the right.
Current usage metrics show cumulative count of Article Views (full-text article views including HTML views, PDF and ePub downloads, according to the available data) and Abstracts Views on Vision4Press platform.
Data correspond to usage on the plateform after 2015. The current usage metrics is available 48-96 hours after online publication and is updated daily on week days.
Initial download of the metrics may take a while.