Fig. B.2.
Download original image
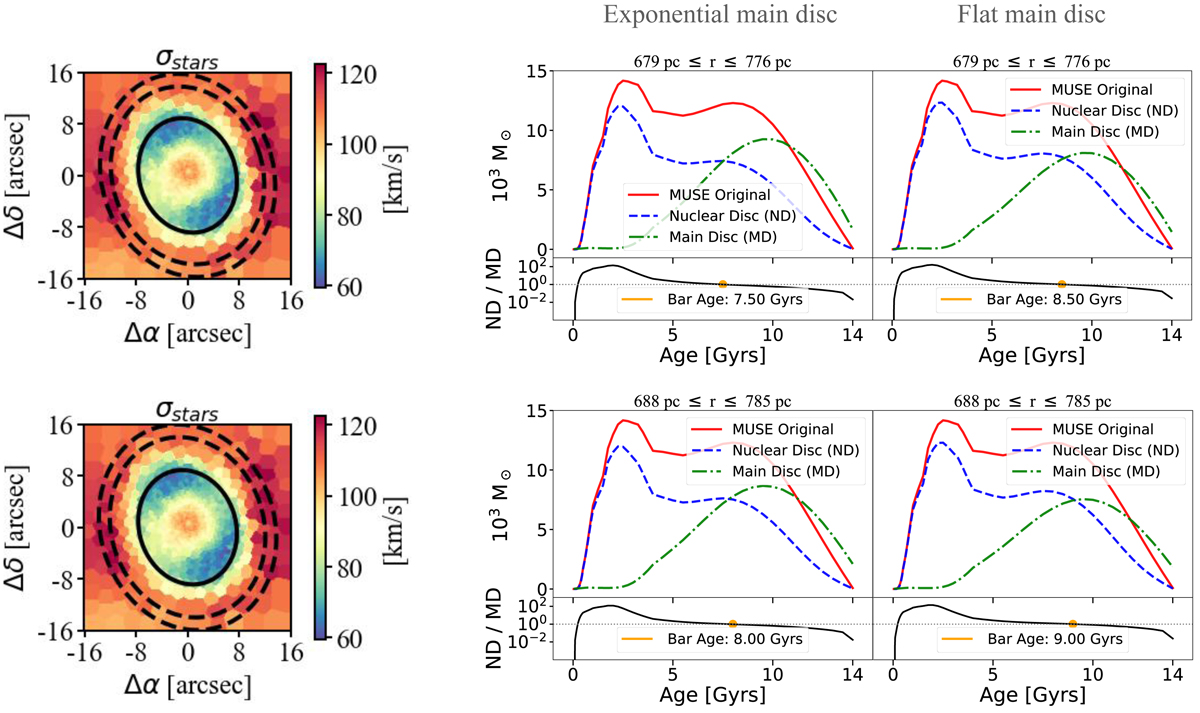
Results for different configurations in the methodology presented in Sect. 3, varying the position of the representative ring (row by row) and the assumed light profile of the main underlying disc. In the first column, we display the stellar velocity dispersion map, indicating the representative ring position with the dashed lines (the solid line corresponds to the peak in v/σ at the outskirts of the ND). In the middle and left columns we display results for exponential and flat light profiles, respectively. One can see that the different configurations result in bar ages in the range 7.0–9.5 Gyr, with the exception of the representative ring closest to the centre. The middle panel of the bottom row corresponds to the standard configuration of our methodology. We note that the mask used that the mask used for the representative ring is slightly different than the one used for the main result. With this, the bar age is slightly older, 8 Gyrs.
Current usage metrics show cumulative count of Article Views (full-text article views including HTML views, PDF and ePub downloads, according to the available data) and Abstracts Views on Vision4Press platform.
Data correspond to usage on the plateform after 2015. The current usage metrics is available 48-96 hours after online publication and is updated daily on week days.
Initial download of the metrics may take a while.