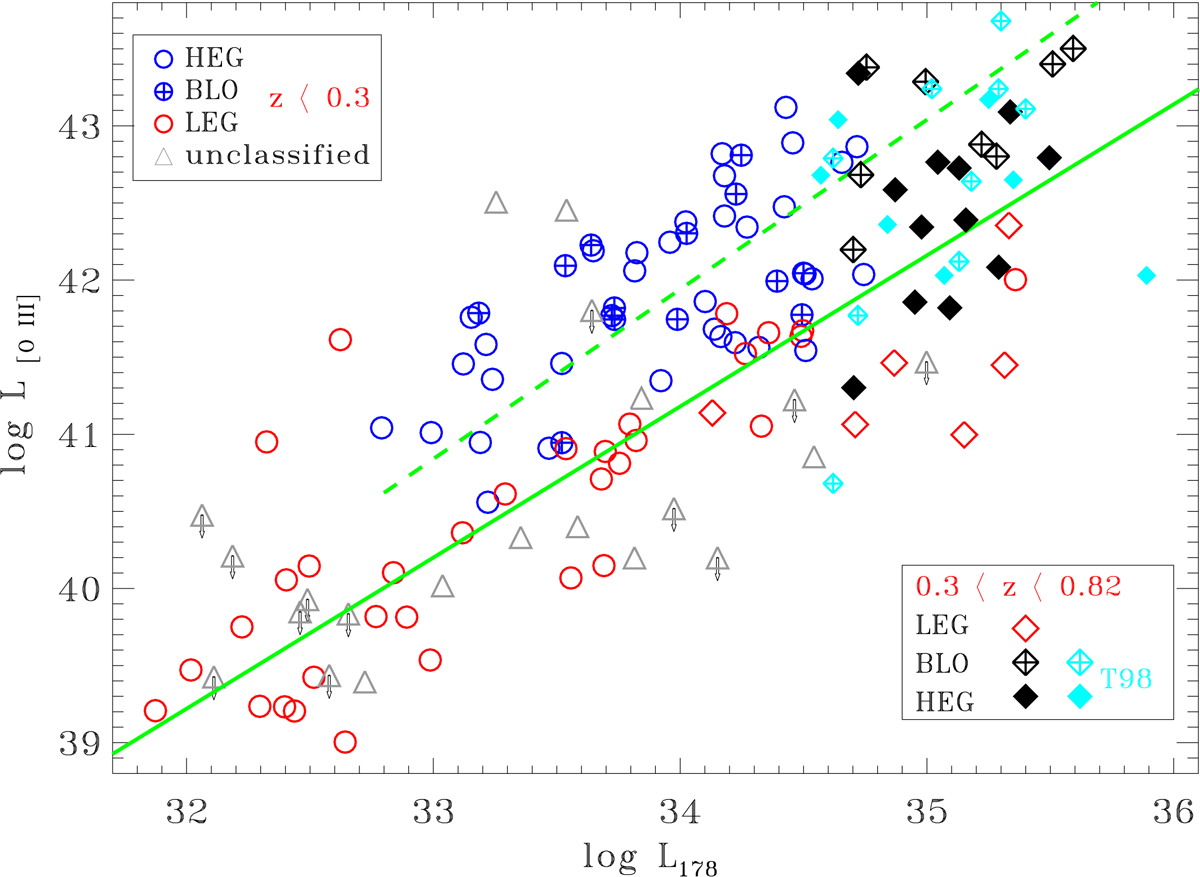
Fig. 3.
Download original image
[O III] (in erg s−1 units) emission line versus radio luminosity (in erg s−1 Hz−1 units) for the 3C sources, separated into the various spectroscopic classes. The data for the objects at z < 0.3 are from Buttiglione et al. (2010, 2011), those at higher redshift are from our analysis. The two green lines represent the linear correlation between radio power and line luminosity derived by Buttiglione et al. (2010) for HEGs (dashed) and LEGs (solid) separately. The cyan symbols represent the izRGs from Tadhunter et al. (1998) added to our sample to improve the statistical significance of our analysis.
Current usage metrics show cumulative count of Article Views (full-text article views including HTML views, PDF and ePub downloads, according to the available data) and Abstracts Views on Vision4Press platform.
Data correspond to usage on the plateform after 2015. The current usage metrics is available 48-96 hours after online publication and is updated daily on week days.
Initial download of the metrics may take a while.