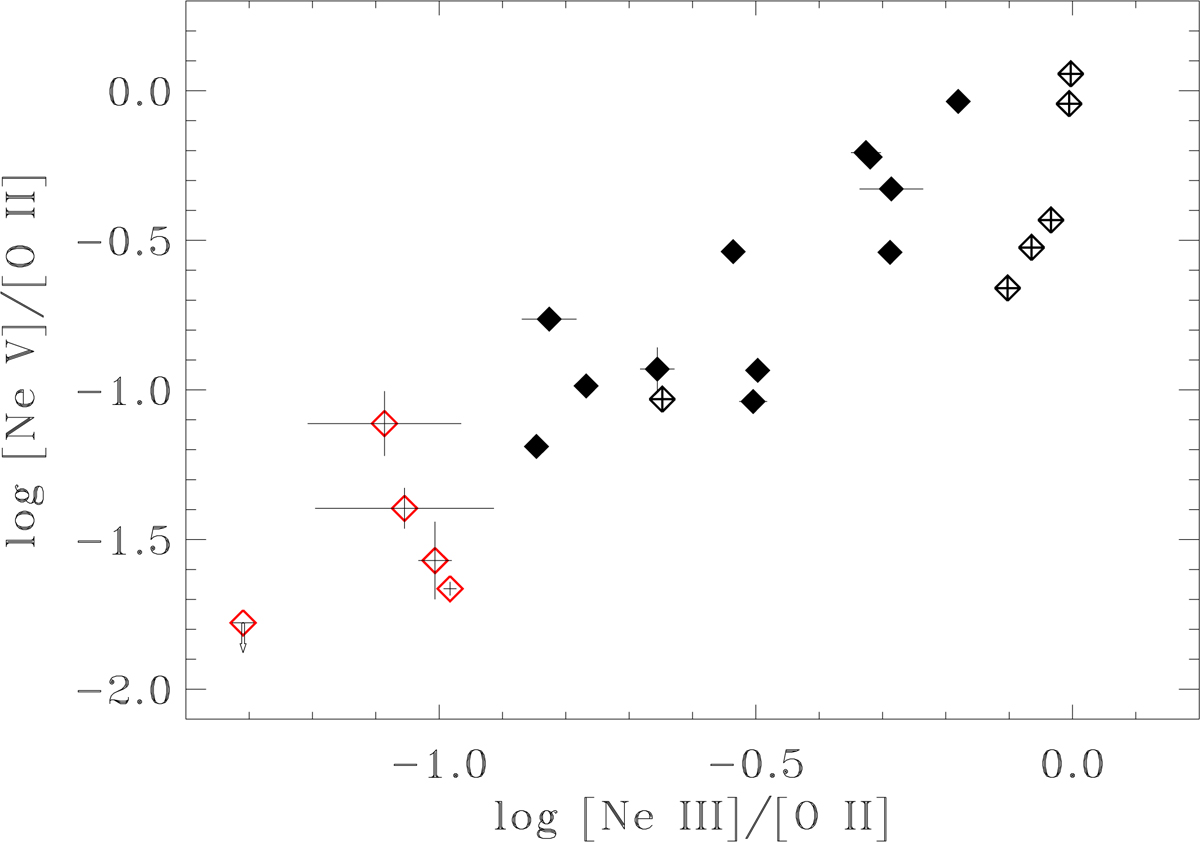
Fig. 2.
Download original image
Diagnostic diagram obtained from line ratios, considering only emission lines with a rest frame wavelength of λ ≤ 3870Å for the 23 RGs with z > 0.4 (i.e., those for which the MUSE spectra include the [Ne V] line). The black filled diamonds are the HEGs, the diamonds surrounding a cross are the BLOs, and the red ones are the LEGs.
Current usage metrics show cumulative count of Article Views (full-text article views including HTML views, PDF and ePub downloads, according to the available data) and Abstracts Views on Vision4Press platform.
Data correspond to usage on the plateform after 2015. The current usage metrics is available 48-96 hours after online publication and is updated daily on week days.
Initial download of the metrics may take a while.