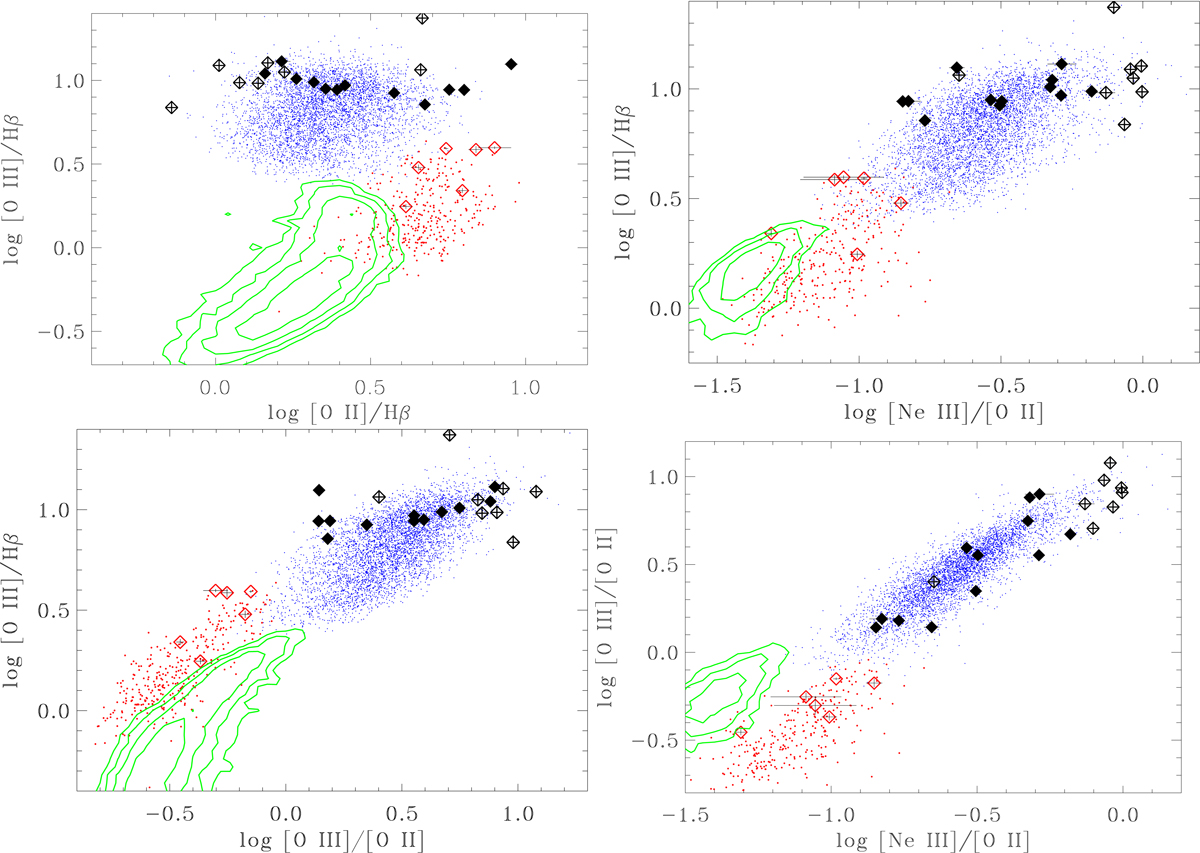
Fig. 1.
Download original image
Diagnostic diagrams obtained considering only emission lines with rest frame wavelength λ ≤ 5007Å for the emission line galaxies in the SDSS/DR7. The blue and red dots represent the location of Seyferts/HEGs and LINERs/LEGs, respectively, selected based on their location in the [O III]/Hβ versus [S II]/Hα diagram. The green contours are the iso-densities of the location of SF galaxies. The diamonds are the 26 3C at 0.3 < z < 0.82 observed with MUSE. The black filled diamonds are the izRGs classified as HEGs, the diamonds surrounding a cross are the BLOs, while the red ones are the LEGs.
Current usage metrics show cumulative count of Article Views (full-text article views including HTML views, PDF and ePub downloads, according to the available data) and Abstracts Views on Vision4Press platform.
Data correspond to usage on the plateform after 2015. The current usage metrics is available 48-96 hours after online publication and is updated daily on week days.
Initial download of the metrics may take a while.