Fig. 7
Download original image
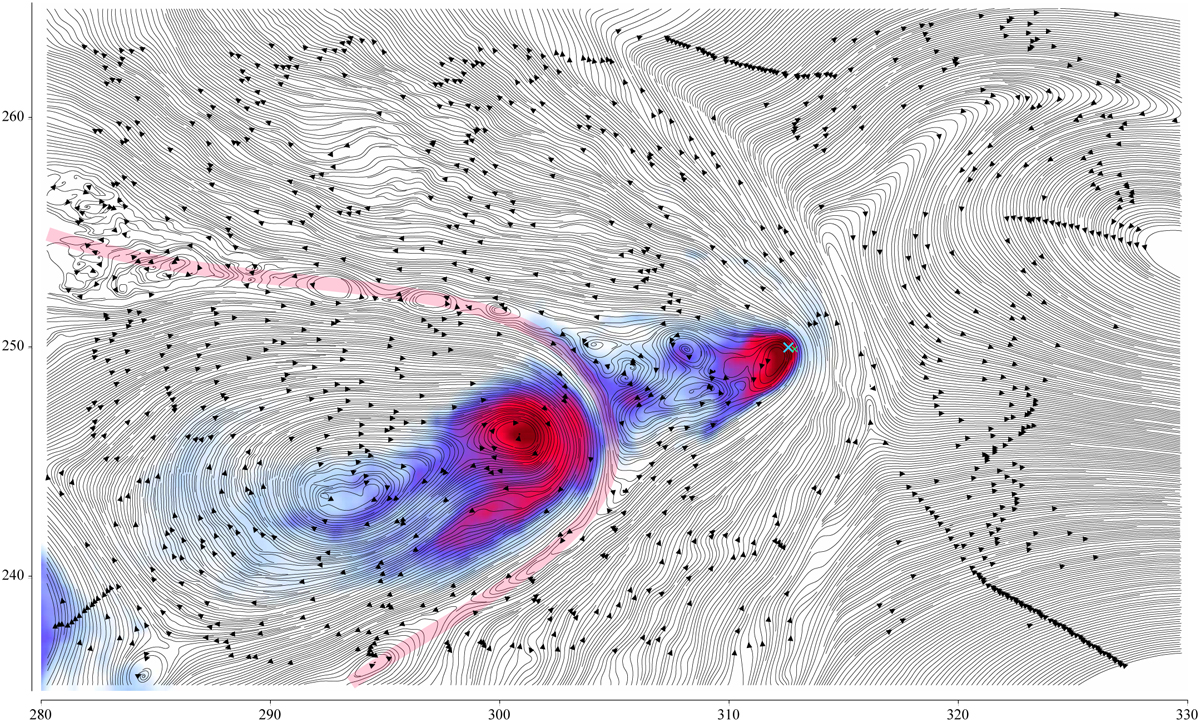
In-plane magnetic field lines, oriented to overlap with the cometary ion density, taken during the fully turbulent simulation of the interaction. The manually added red band indicates a reconnecting current sheet, similar to that in Fig. 6. The larger blue cross indicates the centre of the comet, while the smaller cross shows the position of the synthetic probe used in Sect. 8.
Current usage metrics show cumulative count of Article Views (full-text article views including HTML views, PDF and ePub downloads, according to the available data) and Abstracts Views on Vision4Press platform.
Data correspond to usage on the plateform after 2015. The current usage metrics is available 48-96 hours after online publication and is updated daily on week days.
Initial download of the metrics may take a while.