Open Access
Fig. 6
Download original image
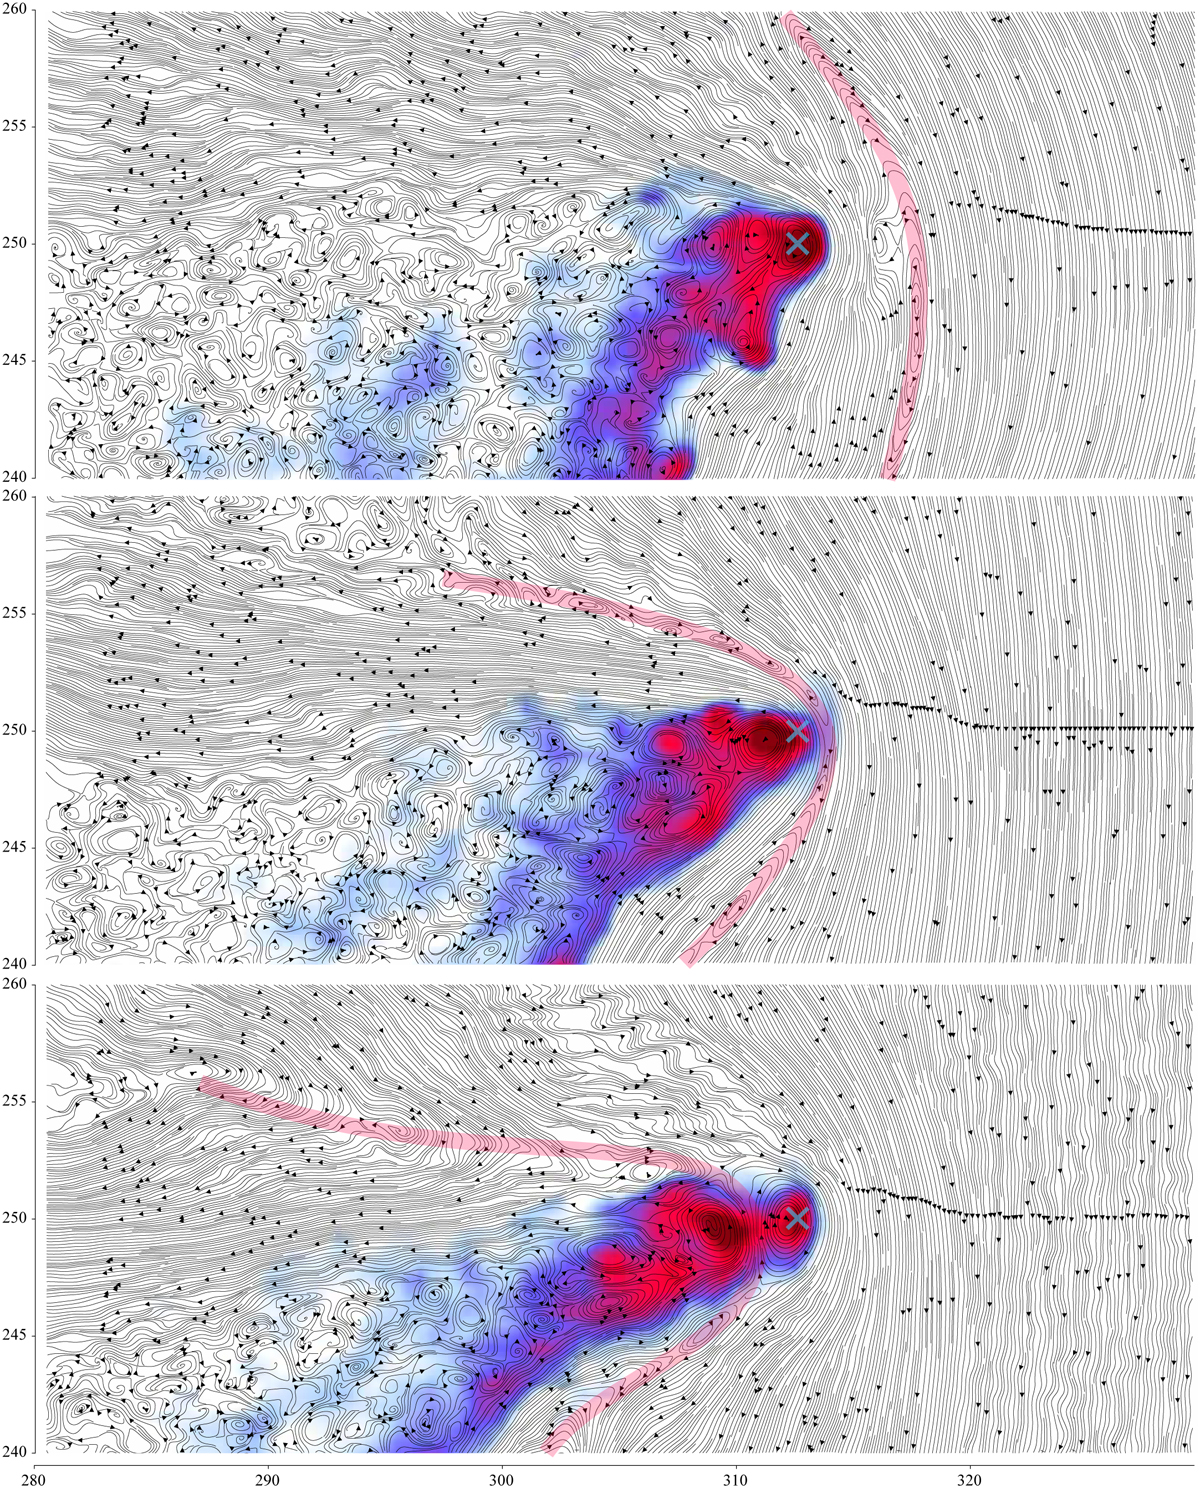
In-plane magnetic field lines, oriented, superimposed on the cometary ion density. The image was taken during the numerical experiment and centre around time t = 6.25 of Fig. 5. The red band was manually added to help follow the main vertical axis of the upstream structure. The blue crosses indicate the centre of the comet.
Current usage metrics show cumulative count of Article Views (full-text article views including HTML views, PDF and ePub downloads, according to the available data) and Abstracts Views on Vision4Press platform.
Data correspond to usage on the plateform after 2015. The current usage metrics is available 48-96 hours after online publication and is updated daily on week days.
Initial download of the metrics may take a while.