Fig. 4
Download original image
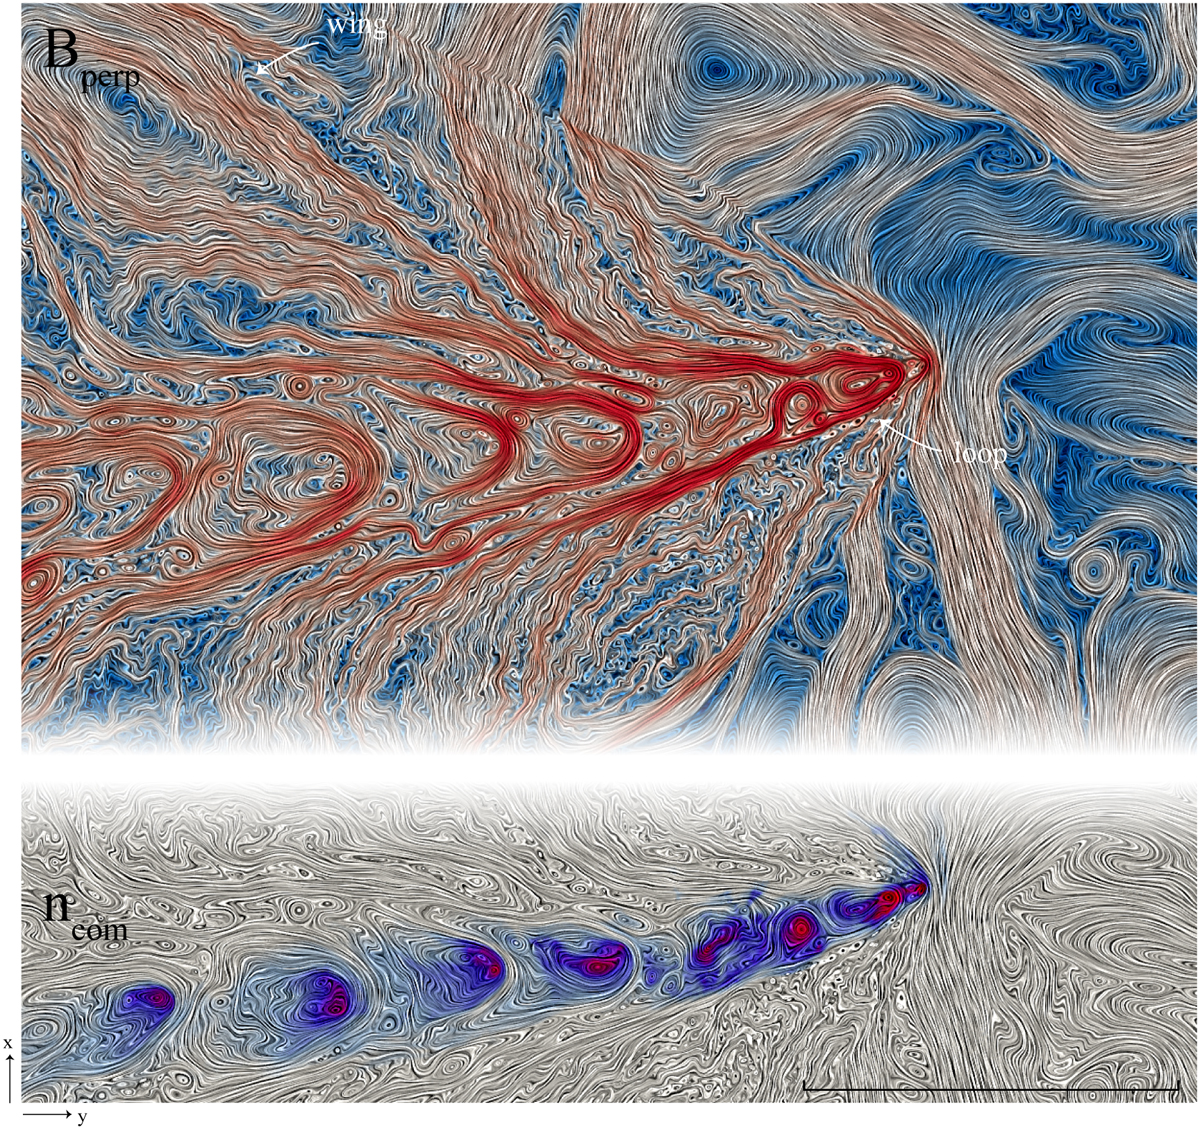
Global view of the magnetic field structures within the interaction region. The upper panel provides a line integral convolution of the in-plane magnetic field component, coupled to its colour-coded amplitude. The lower panel shows the same LIC representation, coupled to the cometary ion density along the comet tail. In the lower panel, lower-right corner, the horizontal line length corresponds to 100 di.
Current usage metrics show cumulative count of Article Views (full-text article views including HTML views, PDF and ePub downloads, according to the available data) and Abstracts Views on Vision4Press platform.
Data correspond to usage on the plateform after 2015. The current usage metrics is available 48-96 hours after online publication and is updated daily on week days.
Initial download of the metrics may take a while.