Fig. 3
Download original image
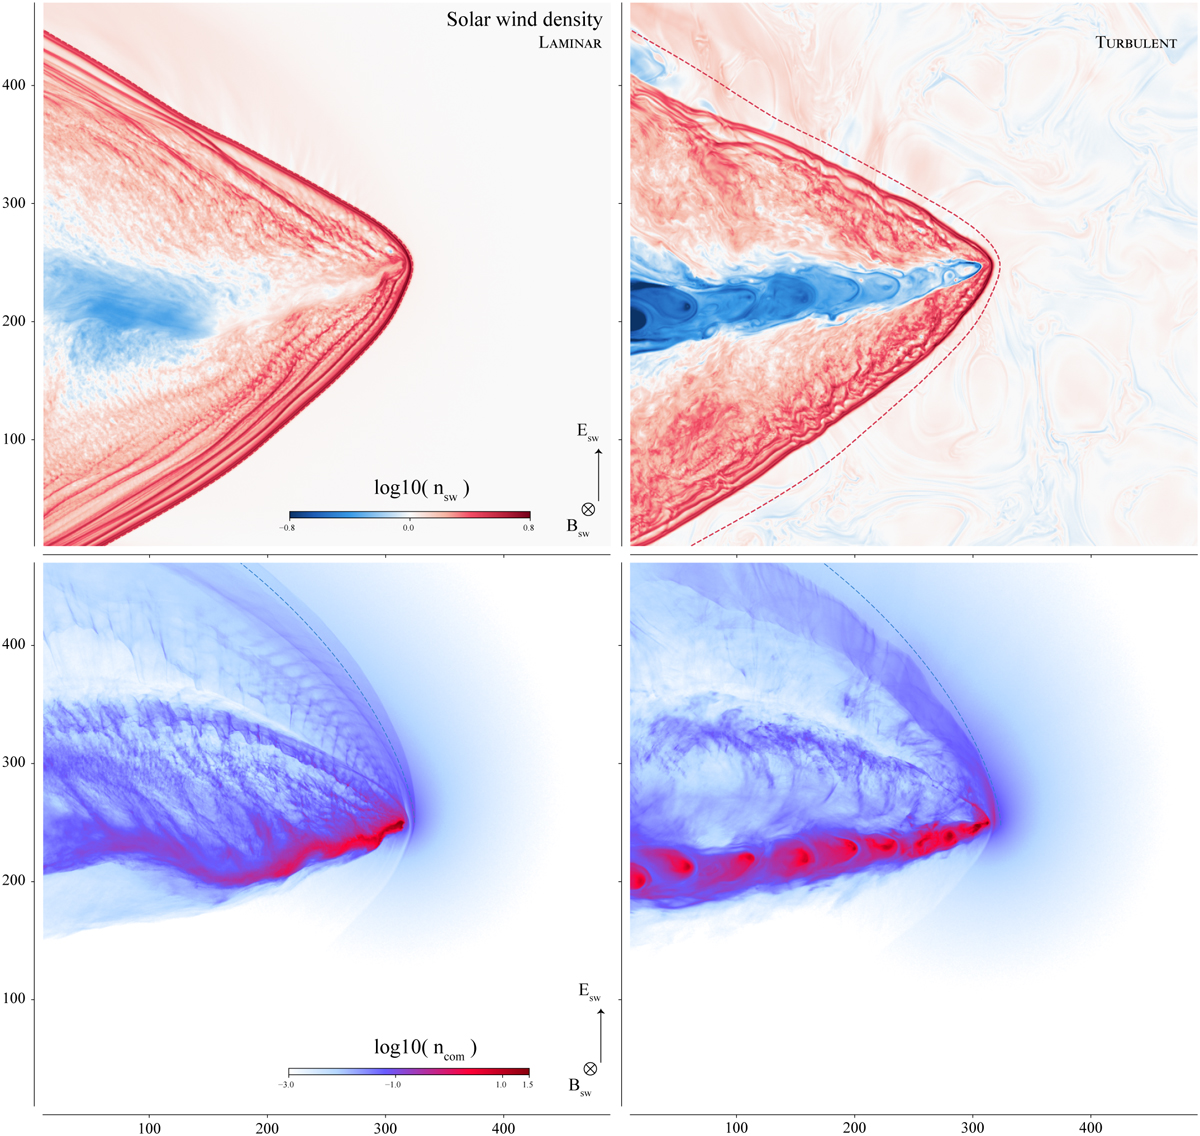
Comparison of the turbulent and laminar interactions. The upper row shows the density of the solar wind ions, while the lower row presents the density of the cometary ions. The left column corresponds to laminar upstream conditions, while the right column corresponds to turbulent upstream conditions. The position of the solar wind overdensity in the laminar case is reported in the turbulent case with the dashed red line. Similarly, the estimated gyration of the cometary ions in the plume in the laminar case is shown in the lower row with a blue dashed line.
Current usage metrics show cumulative count of Article Views (full-text article views including HTML views, PDF and ePub downloads, according to the available data) and Abstracts Views on Vision4Press platform.
Data correspond to usage on the plateform after 2015. The current usage metrics is available 48-96 hours after online publication and is updated daily on week days.
Initial download of the metrics may take a while.