Open Access
Fig. 2
Download original image
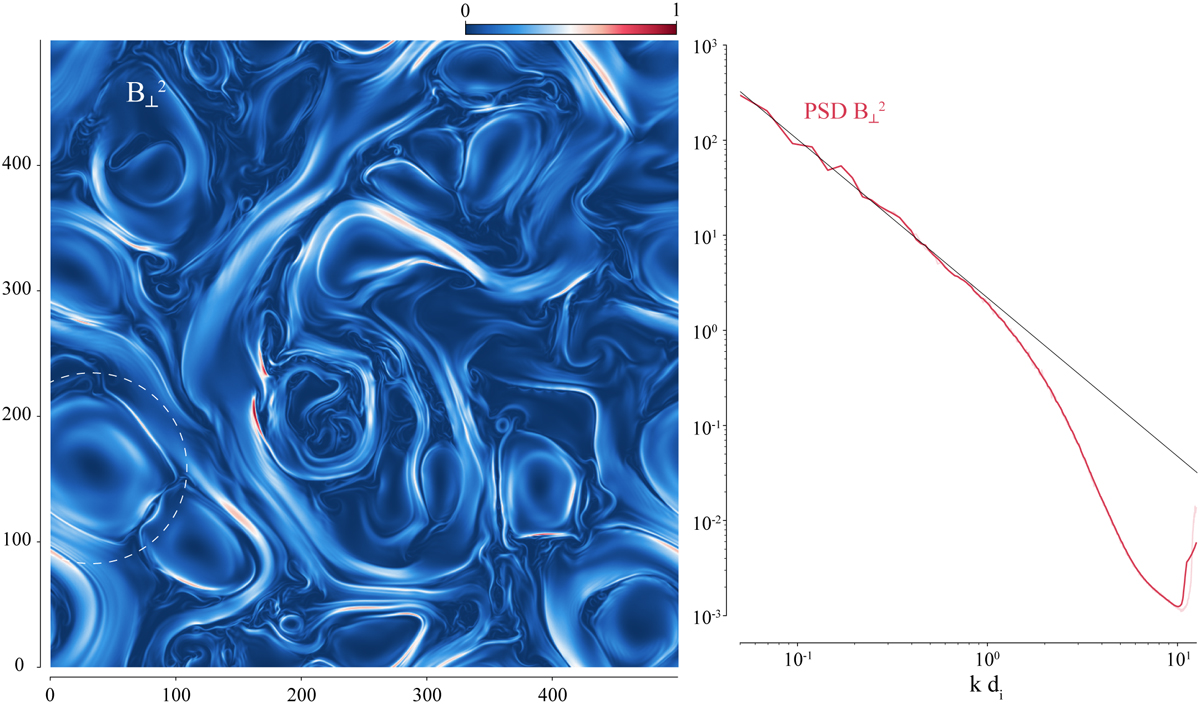
Final state of the turbulent cascade. The left panel provides a map of the perpendicular (or in-plane) magnetic field fluctuations squared. The right panel shows their power spectral density, providing a guideline with slope −5/3.
Current usage metrics show cumulative count of Article Views (full-text article views including HTML views, PDF and ePub downloads, according to the available data) and Abstracts Views on Vision4Press platform.
Data correspond to usage on the plateform after 2015. The current usage metrics is available 48-96 hours after online publication and is updated daily on week days.
Initial download of the metrics may take a while.