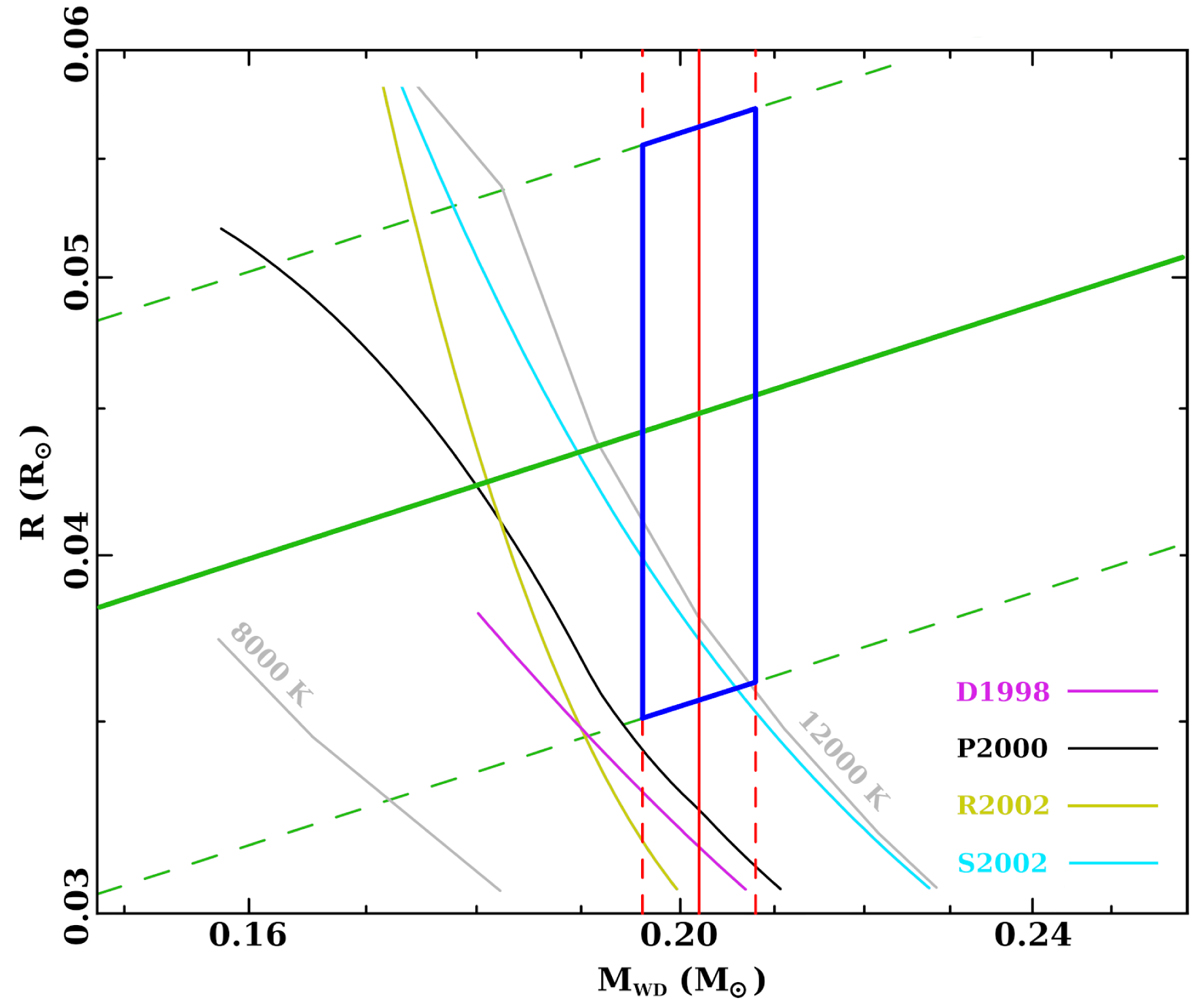
Fig. 7.
Download original image
M–R relations derived by Bassa et al. (2006), and already presented in their Fig. 6, obtained from the following theoretical works: Driebe et al. (1998; magenta; D1998); Panei et al. (2000; black: Teff = 10 090 K, light grey: Teff = 8000 and 12 000 K; P2000); Rohrmann et al. (2002; dark yellow; R2002), andSerenelli et al. (2002; cyan; S2002). The diagonal green and vertical red lines mark the surface gravity measured by Bassa et al. (2006) and our measurement of the PSR J1910−5959A companion’s mass, respectively (solid: best values, dashed: 1σ lower and upper limits). The blue parallelogram delimits the region in the M–R space consistent with the measured surface gravity and companion mass.
Current usage metrics show cumulative count of Article Views (full-text article views including HTML views, PDF and ePub downloads, according to the available data) and Abstracts Views on Vision4Press platform.
Data correspond to usage on the plateform after 2015. The current usage metrics is available 48-96 hours after online publication and is updated daily on week days.
Initial download of the metrics may take a while.