Fig. 4.
Download original image
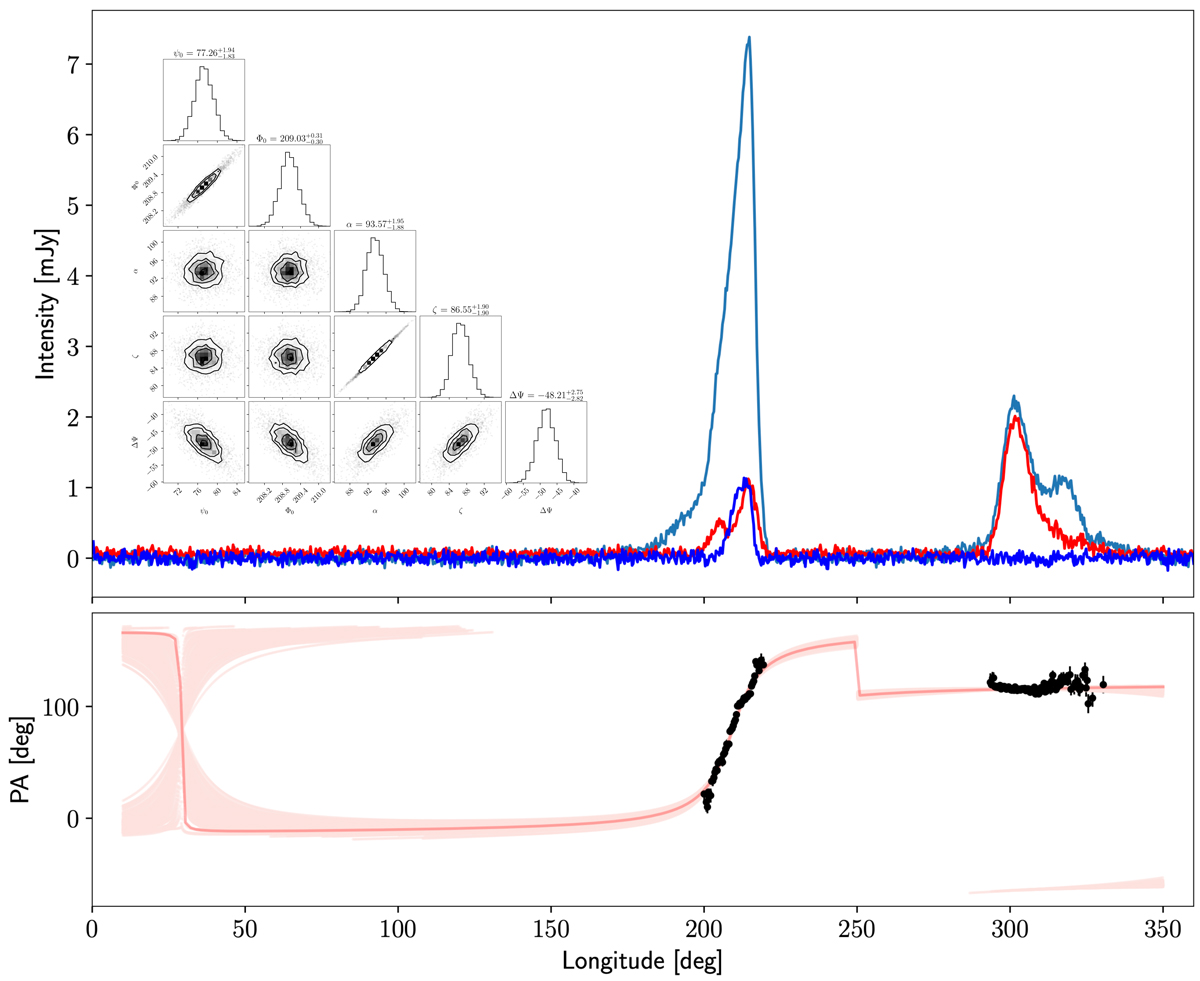
Flux and polarisation calibrated profile of PSR J1910−5959A obtained using the L-band receiver of MeerKAT. Top panel: total intensity, linearly polarised intensity, and circularly polarised intensity shown with the light blue, red, and dark blue lines, respectively. Bottom panel: measured position angle of the linearly polarised component as a function of pulse longitude. The red lines denote different realisations of the modified RVM fit that accounts for a vertical shift of position angle points for the post-cursor, as suggested by Dyks (2019, see the detailed discussion in text), with the darkest line denoting the fit based on the maximum likelihood values. The inset in the top panel shows a corner plot of the posterior distributions of the RVM model parameters, with the off-diagonal elements representing the correlations between parameters and the diagonal elements denoting the marginalised histograms.
Current usage metrics show cumulative count of Article Views (full-text article views including HTML views, PDF and ePub downloads, according to the available data) and Abstracts Views on Vision4Press platform.
Data correspond to usage on the plateform after 2015. The current usage metrics is available 48-96 hours after online publication and is updated daily on week days.
Initial download of the metrics may take a while.