Fig. 3.
Download original image
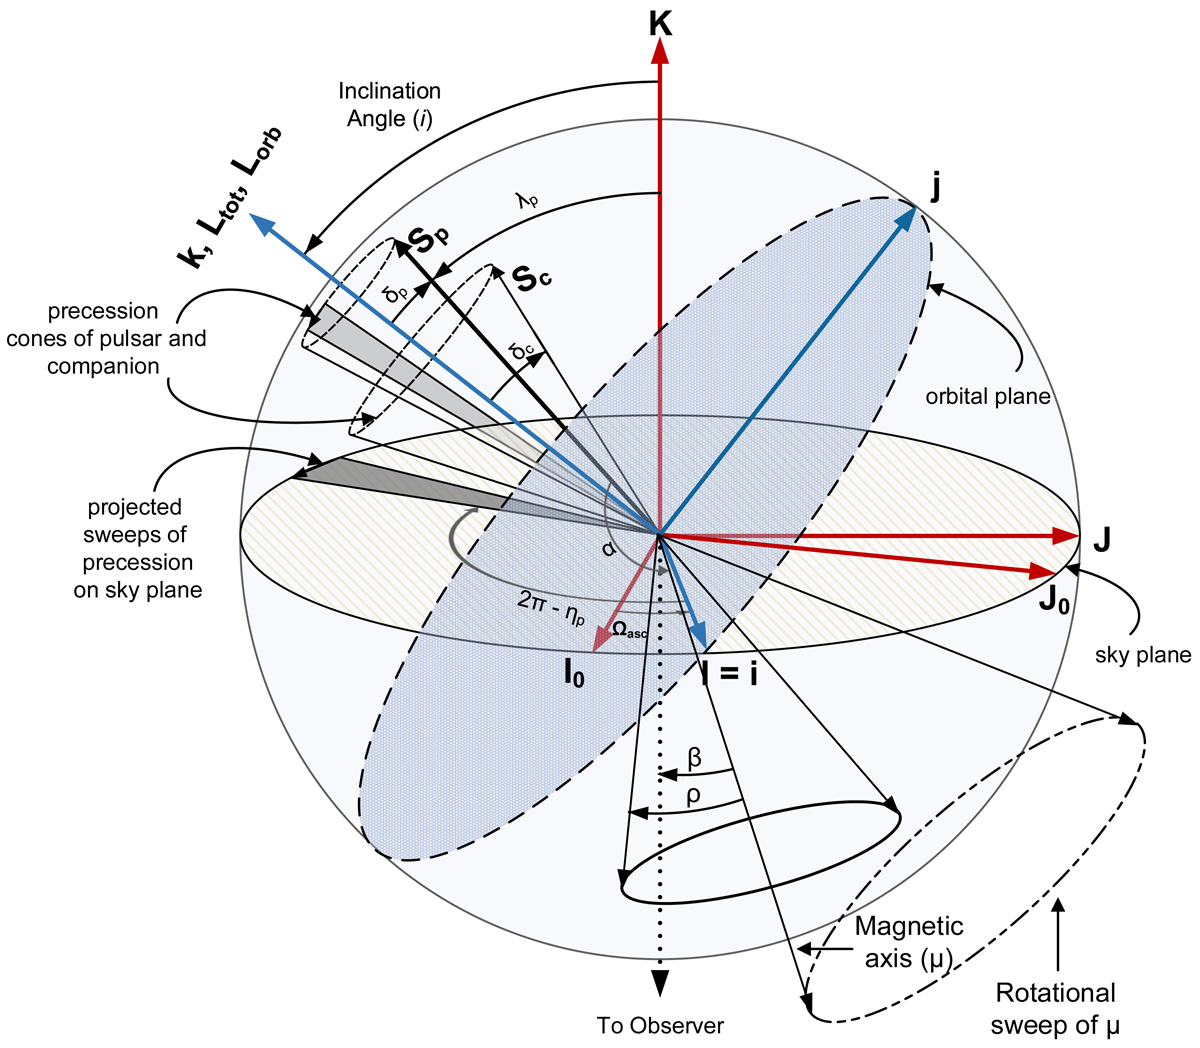
Definition of angles and vectors used, following the DT92 convention (Damour & Taylor 1992). All markers in boldface denote vector quantities. Let K be the line-of-sight vector defined to be from the observer to the pulsar. The plane perpendicular to this vector forms the sky plane, defined by unit vectors I0 and J0. The orbital angular momentum (Lorb) is in the direction of k and is inclined from K by the orbital inclination angle, i. The plane perpendicular to this, defined by unit vectors i and j, is the orbital plane. Ωasc is the angle of rotation of the sky plane with respect to the orbital plane when the pulsar passes through the ascending node. The spin of the pulsar and the companion, defined by vectors Sp and Sc, respectively, are misaligned with Lorb by the spin-misalignment angles δp and δc, respectively. Sp and Sc and Lorb all precess around the total angular momentum of the system, Ltot, which is the vector sum of all the individual angular momenta. However, since the magnitude of Lorb is orders of magnitude more than Sp and Sc, Ltot = Lorb is assumed in the figure for clarity. Hence, Sp and Sc precess around k, forming precession cones as shown. The projection of Sp and Sc on to the sky plane subtends an angle ηp and ηc, respectively – for clarity, only the pulsar’s complementary angle is shown. The pulsar’s magnetic axis (μ) subtends an angle α with respect to Sp. δ denotes the opening angle of the emission cone of the pulsar. As the pulsar rotates, μ sweeps across the sky; the angle suspended by μ during its closest approach with respect to our line of sight is the impact angle β. λp is the angle between K and Sp. Hence, by definition, λp ≡ 180 − ζ ≡ 180 − (α + β), which are the angles used by the RVM.
Current usage metrics show cumulative count of Article Views (full-text article views including HTML views, PDF and ePub downloads, according to the available data) and Abstracts Views on Vision4Press platform.
Data correspond to usage on the plateform after 2015. The current usage metrics is available 48-96 hours after online publication and is updated daily on week days.
Initial download of the metrics may take a while.