Fig. 10.
Download original image
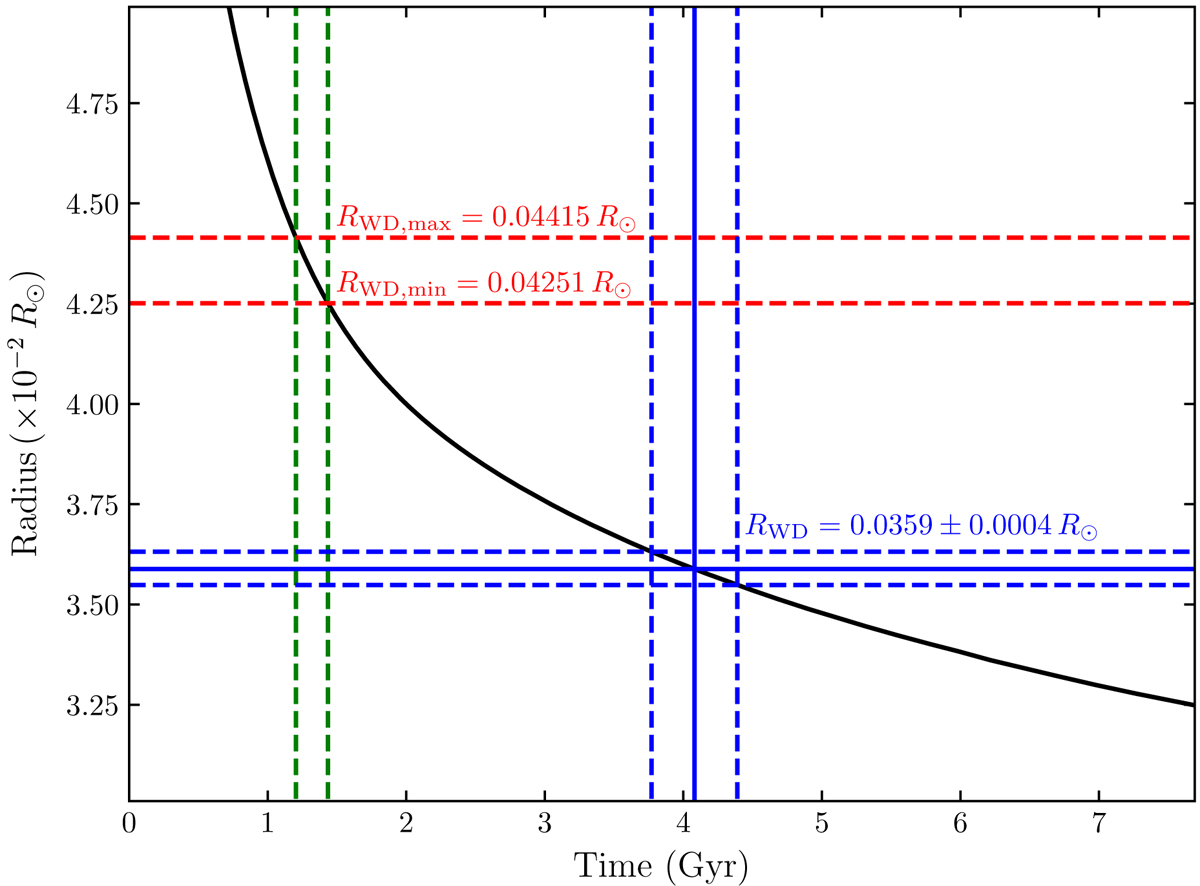
WD radius versus time as predicted by the Istrate et al. (2016) evolution track. The vertical dashed green lines delimit the age range as inferred from Fig. 8 and the red horizontal ones the corresponding WD radius range. The vertical blue line indicates the cooling age deduced from Fig. 9, while the blue horizontal one marks the corresponding WD radius. Dashed blue lines delimit 1σ uncertainty ranges.
Current usage metrics show cumulative count of Article Views (full-text article views including HTML views, PDF and ePub downloads, according to the available data) and Abstracts Views on Vision4Press platform.
Data correspond to usage on the plateform after 2015. The current usage metrics is available 48-96 hours after online publication and is updated daily on week days.
Initial download of the metrics may take a while.