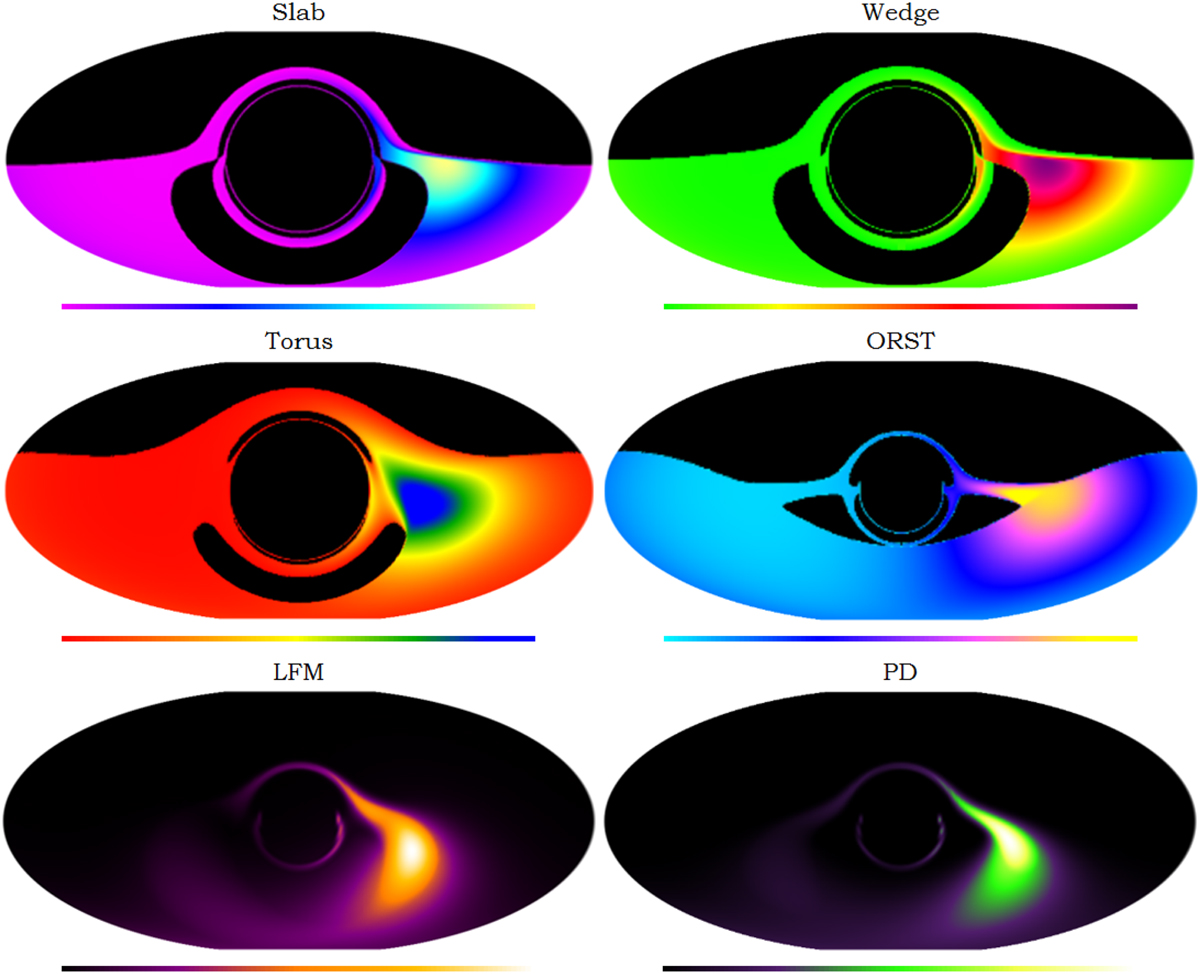
Fig. 9
Download original image
Mollweide projection sky maps of the frequency-integrated specific intensity, I. Each image shows the run results for a different disk model (Sect. 2.3a–f). Below each image, the model's color scale is displayed from minimum (left) to maximum (right). The circle of radiation in the center of each image is an Einstein-Khvolson or “echo” ring (Sauer 2008) created by photons traversing the disk area and reaching the observer after traveling above and below the BH horizon and AD. The radiation intensity difference between the left and right half of each image is due to the rotation of the AD. Radiation from material moving toward the observer is boosted, while radiation from material moving away is deboosted.
Current usage metrics show cumulative count of Article Views (full-text article views including HTML views, PDF and ePub downloads, according to the available data) and Abstracts Views on Vision4Press platform.
Data correspond to usage on the plateform after 2015. The current usage metrics is available 48-96 hours after online publication and is updated daily on week days.
Initial download of the metrics may take a while.