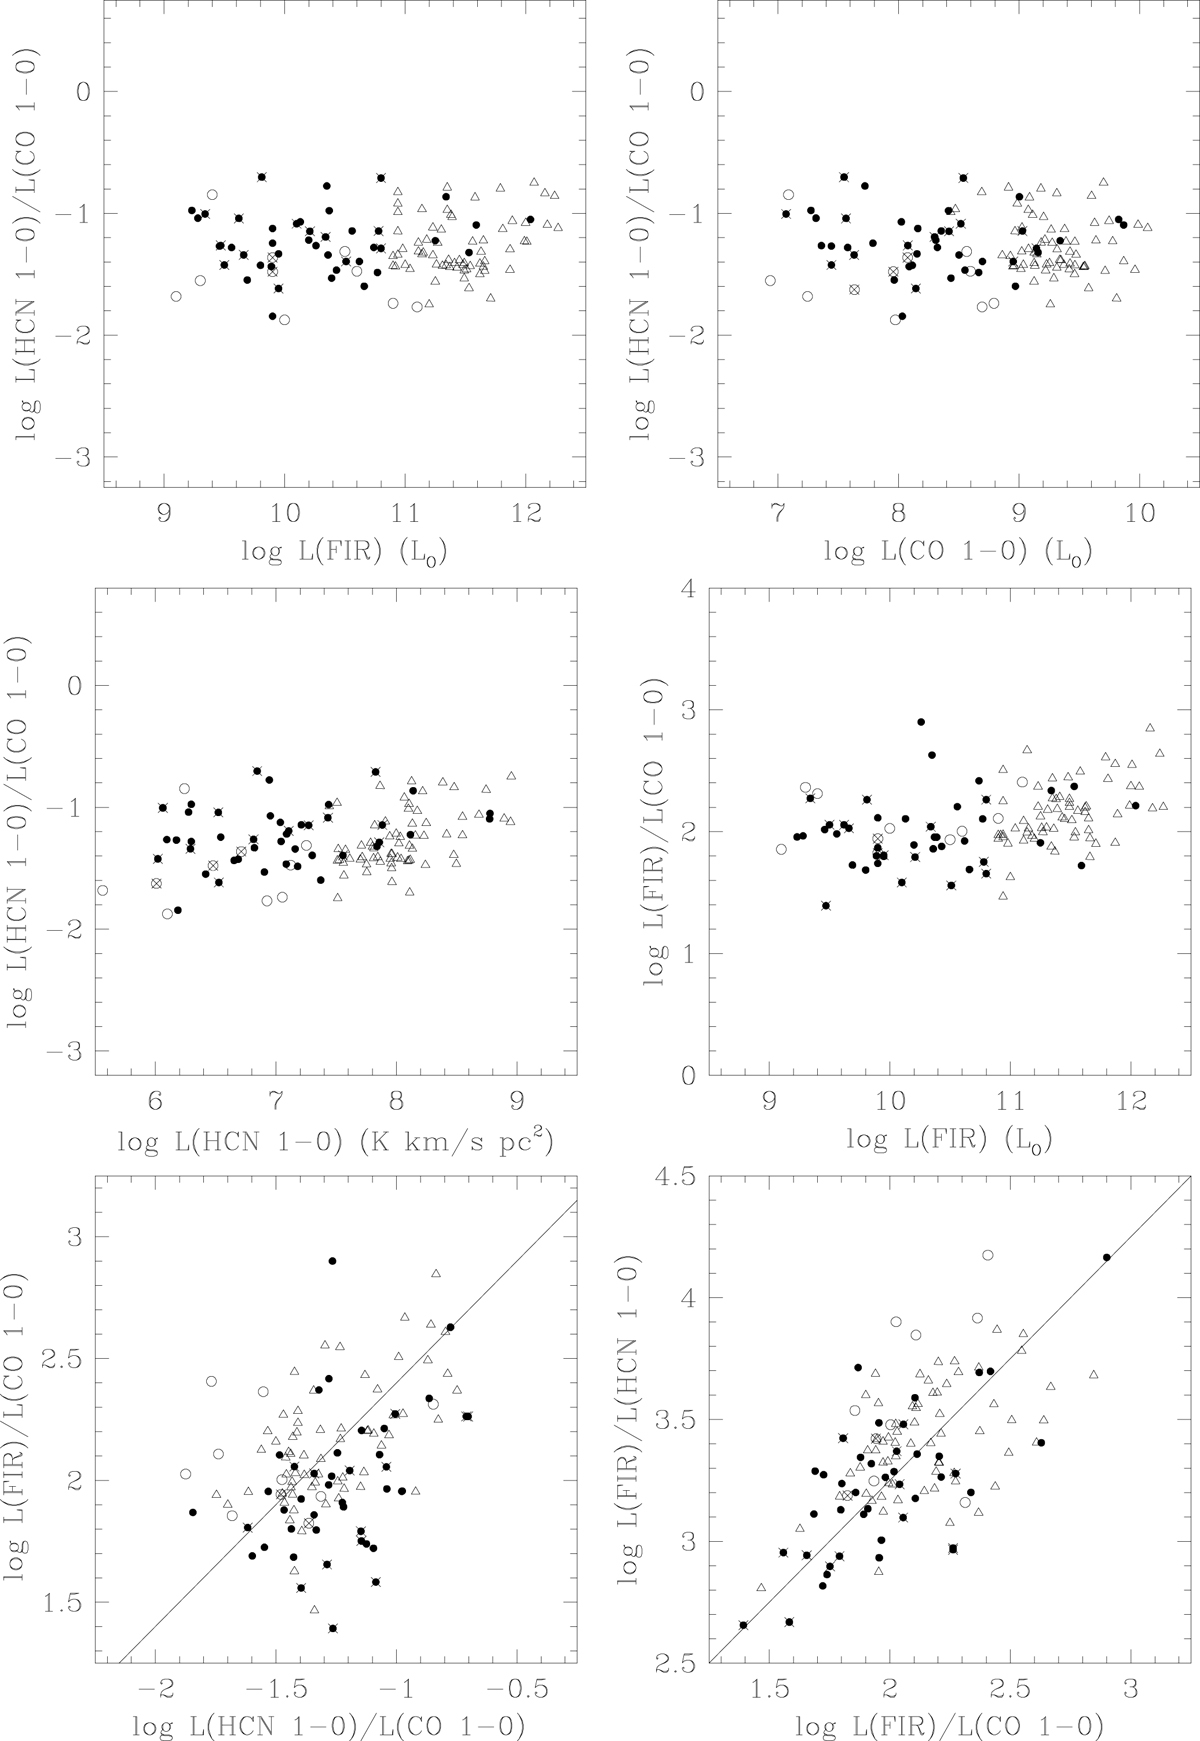
Fig. 4.
Download original image
Top row: the J = 1 − 0 HCN/CO ratio as a function of IRAS FIR luminosity (left) and J = 1 − 0 CO luminosity (right). The horizontal line in the panel at left marks the ratio separating normal and luminous galaxies in the paper by Gao & Solomon (2004b). Neither panel shows any increase in HCN/CO at (U)LIRG luminosities, nor any change in the dispersion of the ratio. Center row: the HCN/CO ratio as a function of L(HCN), (left) and the FIR/CO ratio as a function of L(FIR), (right). Bottom row: the FIR/CO ratio versus HCN/CO ratio (left); the FIR/HCN ratio versus the FIR/CO ratio (right). In both panels, straight lines mark unity slopes. Fit parameters are listed in Table 8.
Current usage metrics show cumulative count of Article Views (full-text article views including HTML views, PDF and ePub downloads, according to the available data) and Abstracts Views on Vision4Press platform.
Data correspond to usage on the plateform after 2015. The current usage metrics is available 48-96 hours after online publication and is updated daily on week days.
Initial download of the metrics may take a while.