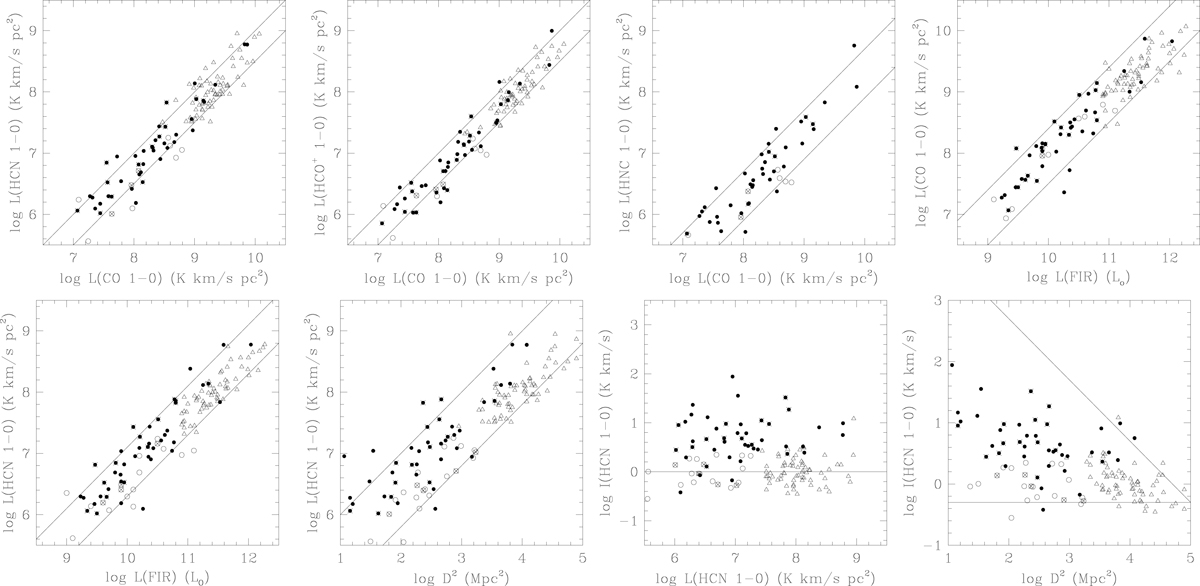
Fig. 3.
Download original image
Top row: galaxy center luminosity-luminosity relations in identical 22″ beams. Leftmost panels: J = 1 − 0 HCN and HCO+ versus 12CO with constant ratios 0.10 and 0.03 marked by solid lines. Rightmost panels: HNC(1−0) versus 12CO with constant ratios 0.050 and 0.008, and central 12CO versus global far-infrared (FIR) continuum with constant ratios 2.5 × 10⁻² and 3.2 × 10⁻³ K km s−1 pc2/L⊙ marked. Bottom row, leftmost panel: central HCN(1−0) versus global FIR continuum with constant ratios of 2 × 10⁻³ and 1.25 × 10⁻⁴ marked, very similar to the HCN/CO (top left) and HCN/FIR (top right) diagrams. Center left panel: relation between HCN luminosity (L(HCN) ∝ I(HCN) × D2) and distance (D2). Center right panel: relation between luminosity L(HCN) and intensity I(HCN); vertical line marks constant surface brightness of 1 K km s−1. Rightmost panel: relation between I(HCN) and distance (D2), with a horizontal line of resolved surface brightness of 0.5 K km s−1 and a diagonal line of unresolved point-like emission (cf. Table 1). In these and following diagrams, filled circles denote the new data from this paper, open circles literature data on similar galaxies, crosses galaxies with an identified AGN and triangles literature survey data on (U)LIRGs. The results of least-squares regression fits, of the form log(y) = alog(x)+b, to the data in this figure and the following figures are given in Table 8.
Current usage metrics show cumulative count of Article Views (full-text article views including HTML views, PDF and ePub downloads, according to the available data) and Abstracts Views on Vision4Press platform.
Data correspond to usage on the plateform after 2015. The current usage metrics is available 48-96 hours after online publication and is updated daily on week days.
Initial download of the metrics may take a while.