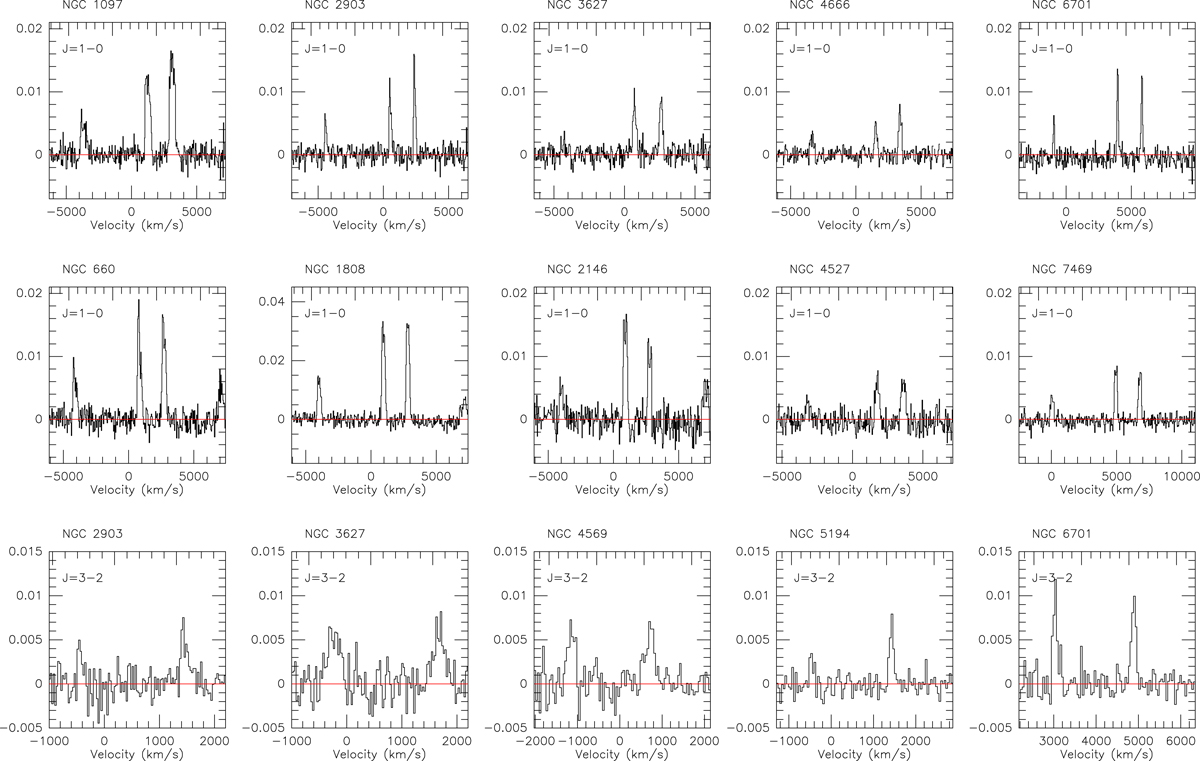
Fig. 1.
Download original image
Sample of molecular line profiles of galaxy centers observed with the IRAM 30 m telescope. Galaxy and transition depicted are identified at the top of each panel. The top row shows J = 1 − 0 observations of (in each panel from left to right) HNC, HCO+, and HCN observed in 2010. The middle row shows the same lines and includes the C2H at the very right, observed in 2011. The bottom row shows J = 3 − 2 observations of HCO+ (left) and HCN (right). In all panels the vertical scale is intensity ![]() (K) and the horizontal scale is velocity V(LSR) in km s−1.
(K) and the horizontal scale is velocity V(LSR) in km s−1.
Current usage metrics show cumulative count of Article Views (full-text article views including HTML views, PDF and ePub downloads, according to the available data) and Abstracts Views on Vision4Press platform.
Data correspond to usage on the plateform after 2015. The current usage metrics is available 48-96 hours after online publication and is updated daily on week days.
Initial download of the metrics may take a while.