Fig. A.2
Download original image
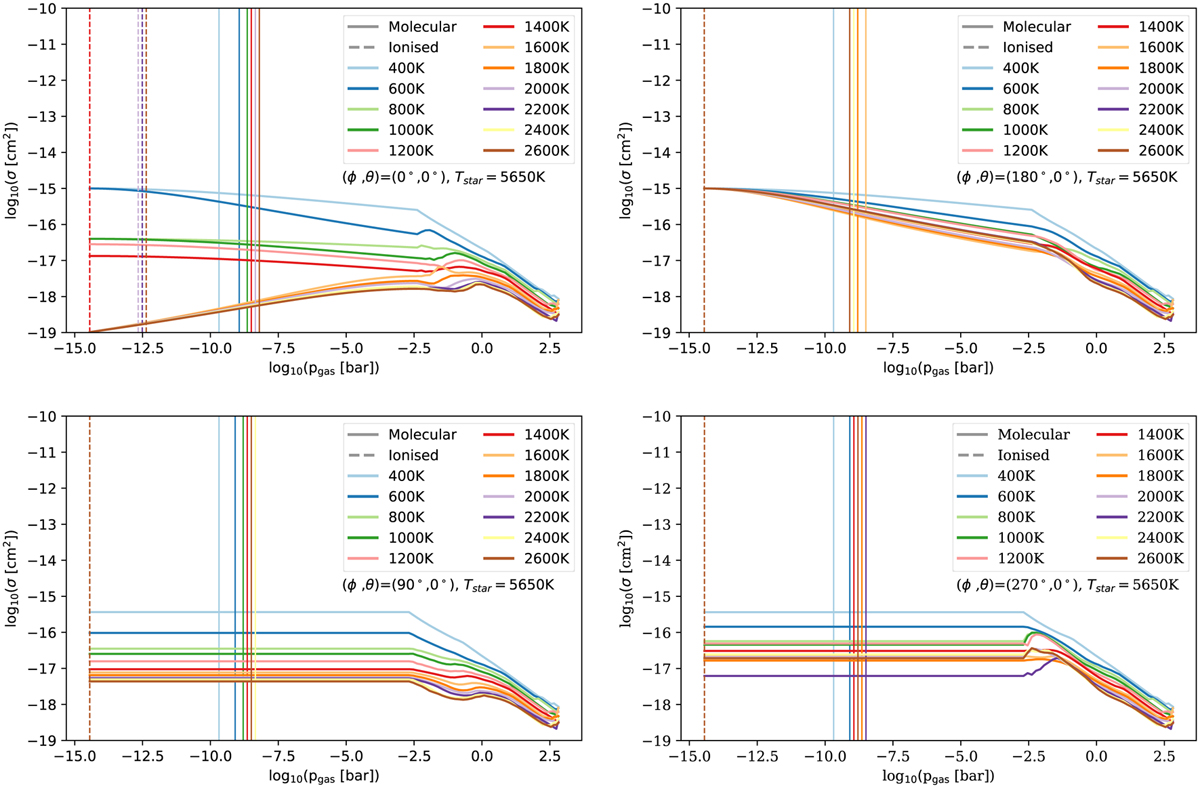
Cross sectional area of the gas particles as a function of pressure, with vertical lines denoting the pressure at which the Knudsen number exceeds 1. The solid vertical lines show the pressure limit for the molecular gas, and the dashed lines show the pressure limit for the fully ionised gas. The profiles are shown for all planetary effective temperatures for the sub-stellar, anti-stellar, morning terminator and evening terminator points. All the models have log(g)=3 [cgs] and orbit G5 stars.
Current usage metrics show cumulative count of Article Views (full-text article views including HTML views, PDF and ePub downloads, according to the available data) and Abstracts Views on Vision4Press platform.
Data correspond to usage on the plateform after 2015. The current usage metrics is available 48-96 hours after online publication and is updated daily on week days.
Initial download of the metrics may take a while.