Fig. 15
Download original image
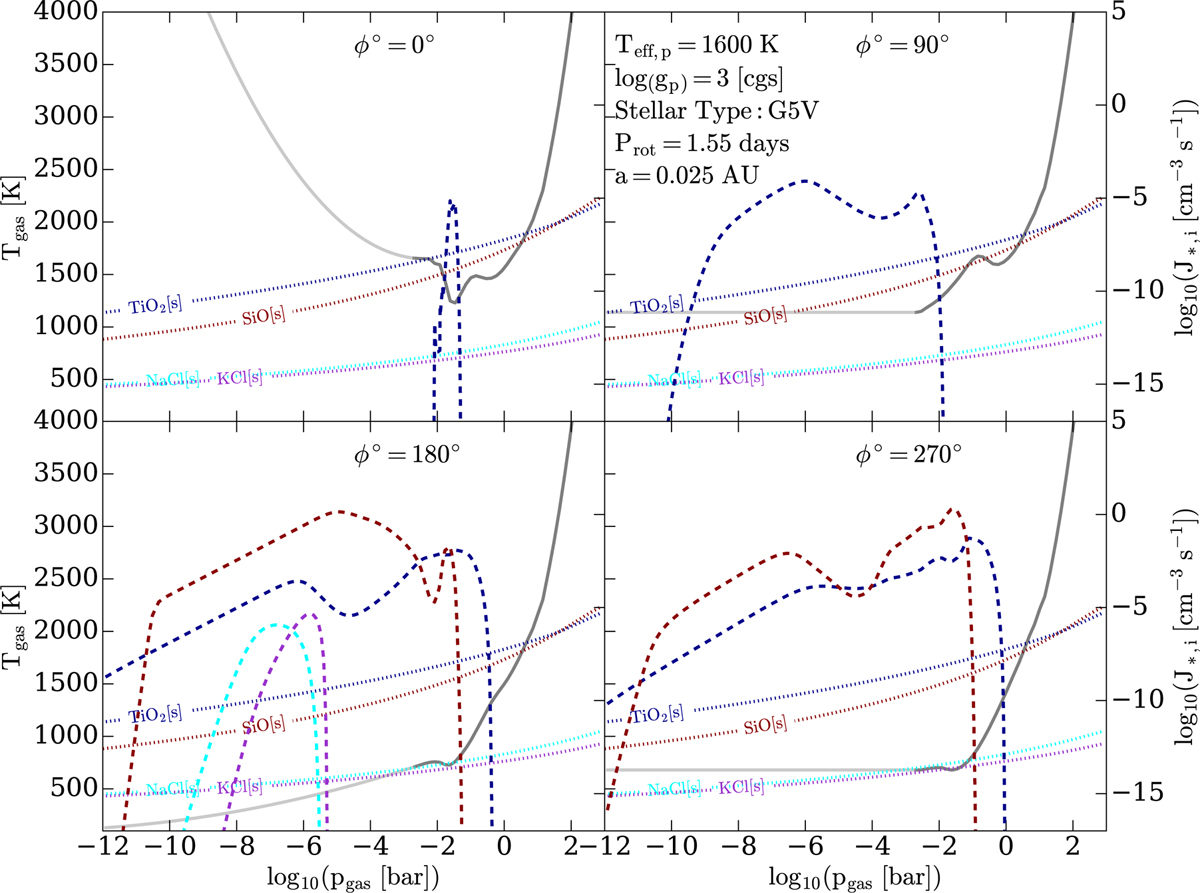
Nucleation rates, J*,i [cm−3 s−1] (dashed lines), in the extended, low-pressure extrapolated substellar, antistellar, and equatorial morning and evening terminator (Tgas, pgas)-profiles (solid dark grey lines) for the G star planet atmosphere (Teff,P = 1600 K, log(ɡ) = 3 [cgs]). The nucleation rates for TiO2 (dark blue), SiO (brown), KCl (magenta), NaCl (cyan) and the thermal stability curves (supersaturation ratio S = 1 for solar element abundances; dotted lines) for their respective solid condensates are shown. The Si = 1 curves do not represent our full kinetic model approach and are provided here for the purpose of visualisation only.
Current usage metrics show cumulative count of Article Views (full-text article views including HTML views, PDF and ePub downloads, according to the available data) and Abstracts Views on Vision4Press platform.
Data correspond to usage on the plateform after 2015. The current usage metrics is available 48-96 hours after online publication and is updated daily on week days.
Initial download of the metrics may take a while.