Fig. 6.
Download original image
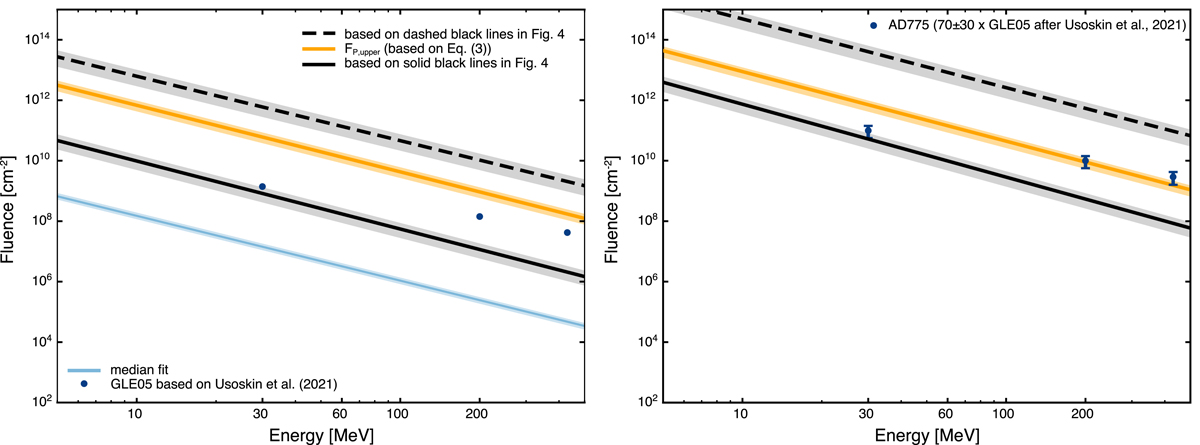
Derived fluence spectra for the two solar cases under investigation. The left panel corresponds to GLE05; the right panel corresponds to the AD774/775 SEP event. These plots are similar to Fig. 3, but for a fluence with the addition of the relevant data points for each event (based on Usoskin et al. 2021), depicted as filled blue circles, and the corresponding derived spectra calculated for each case from the relations presented in Sect. 3.
Current usage metrics show cumulative count of Article Views (full-text article views including HTML views, PDF and ePub downloads, according to the available data) and Abstracts Views on Vision4Press platform.
Data correspond to usage on the plateform after 2015. The current usage metrics is available 48-96 hours after online publication and is updated daily on week days.
Initial download of the metrics may take a while.