Fig. 5.
Download original image
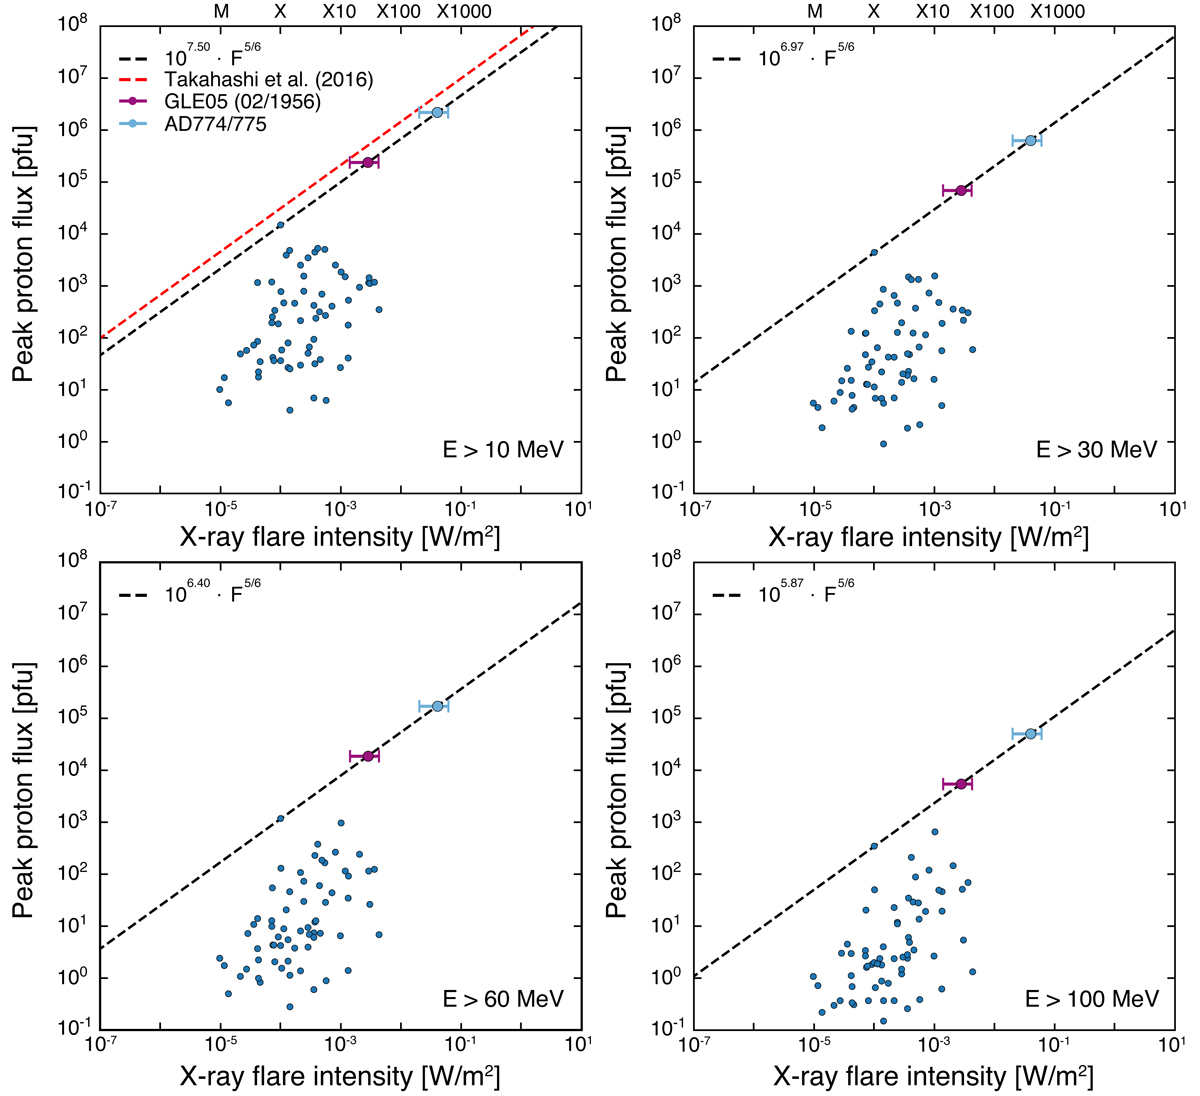
IP ∝ FSXR relations for the four integral energy bands of the SEP events: E > 10 (top left); E > 30 (top right); E > 60 (bottom left); and E > 100 MeV (bottom right). The estimated SXR flare mean values for the events of 23 February 1956 and AD774/775 are represented as purple and cyan filled circles, respectively. The plotted SXR intensities were obtained by dividing the values in Appendix C by 0.7 to reflect the recent NOAA recalibration (Hudson et al., in prep.; Cliver et al. 2022).
Current usage metrics show cumulative count of Article Views (full-text article views including HTML views, PDF and ePub downloads, according to the available data) and Abstracts Views on Vision4Press platform.
Data correspond to usage on the plateform after 2015. The current usage metrics is available 48-96 hours after online publication and is updated daily on week days.
Initial download of the metrics may take a while.