Fig. 4.
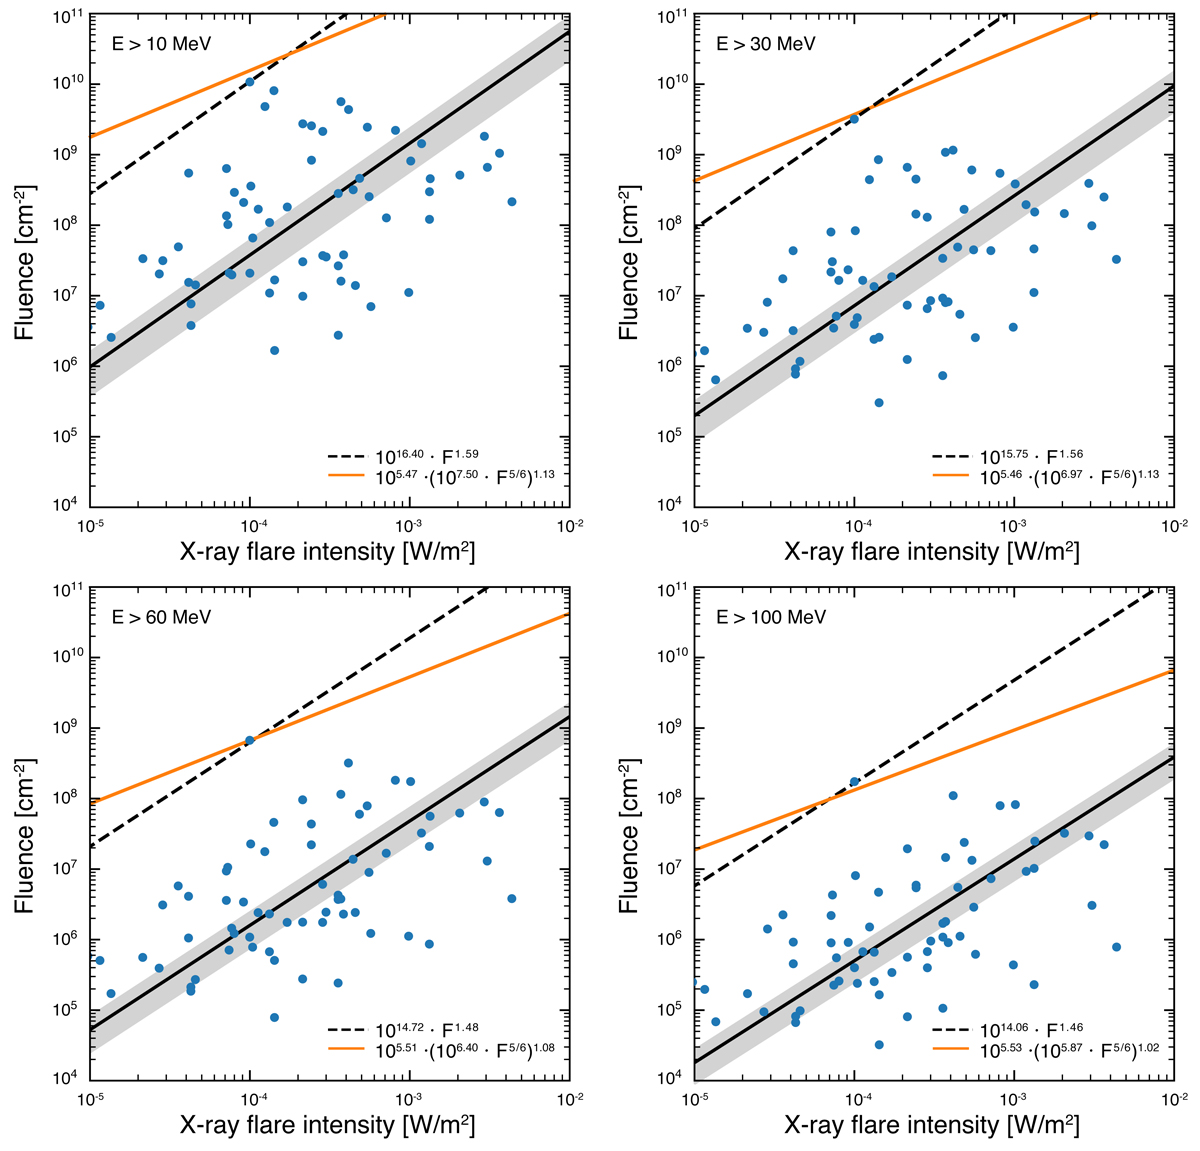
Download original image
FP ∝ FSXR relations for the four integral energy bands of the SEP events: E > 10 (top left); E > 30 (top right); E > 60 (bottom left); and E > 100 MeV (bottom right). The log-log relations are obtained with the RMA regression fitting (solid black line). The estimated upper limits of FP in terms of FSXR based on Takahashi et al. (2016) are depicted as solid orange lines in each panel. The dashed black lines are similar to the RMA line scaled to the uppermost point of the sample.
Current usage metrics show cumulative count of Article Views (full-text article views including HTML views, PDF and ePub downloads, according to the available data) and Abstracts Views on Vision4Press platform.
Data correspond to usage on the plateform after 2015. The current usage metrics is available 48-96 hours after online publication and is updated daily on week days.
Initial download of the metrics may take a while.