Open Access
Fig. 3.
Download original image
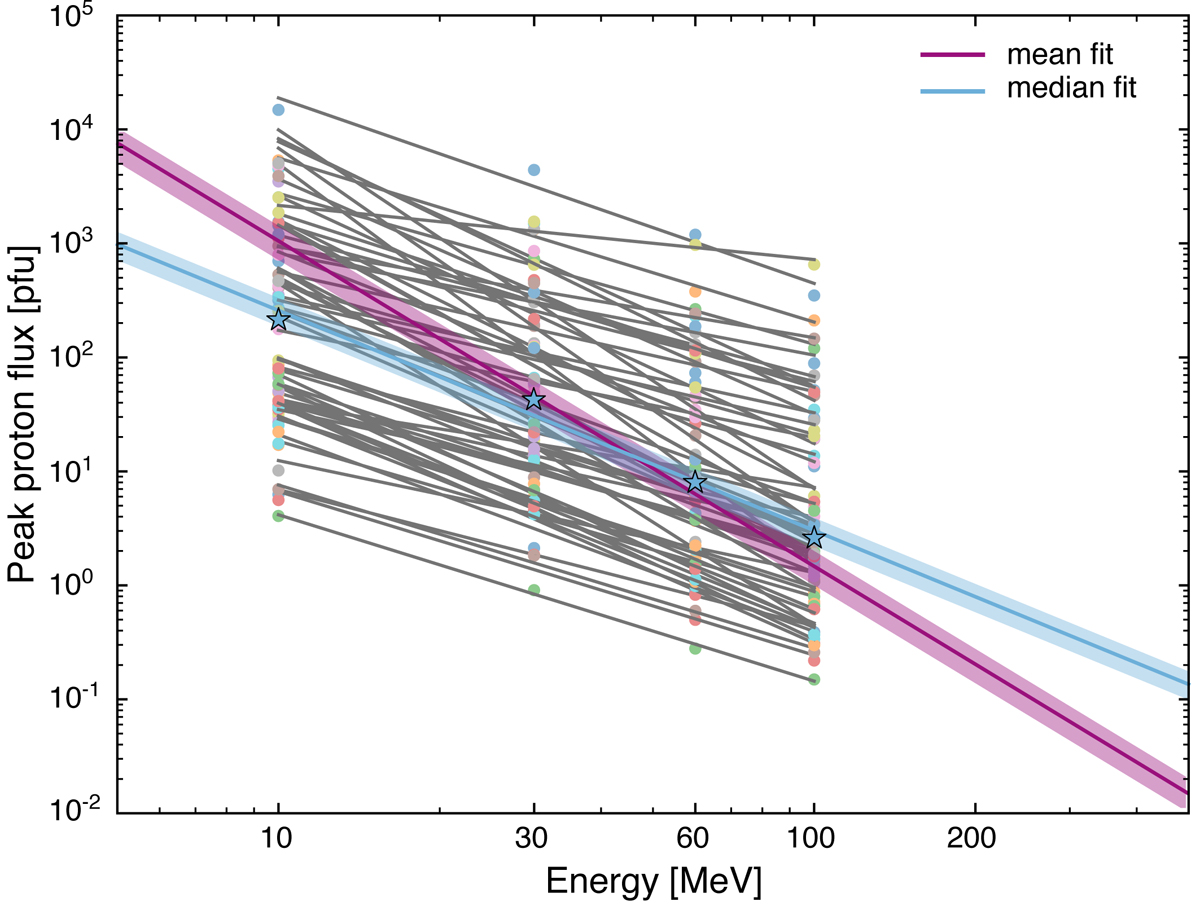
Derived spectrum for the 65 SEP events, assumed to follow an inverse power law (gray lines). The mean spectrum is shown as a continuous magenta line (ϵmean = 2.87), while the blue line provides the median spectrum (ϵmedian = 1.96). The blue stars represent the median peak proton flux values per energy.
Current usage metrics show cumulative count of Article Views (full-text article views including HTML views, PDF and ePub downloads, according to the available data) and Abstracts Views on Vision4Press platform.
Data correspond to usage on the plateform after 2015. The current usage metrics is available 48-96 hours after online publication and is updated daily on week days.
Initial download of the metrics may take a while.