Fig. 2.
Download original image
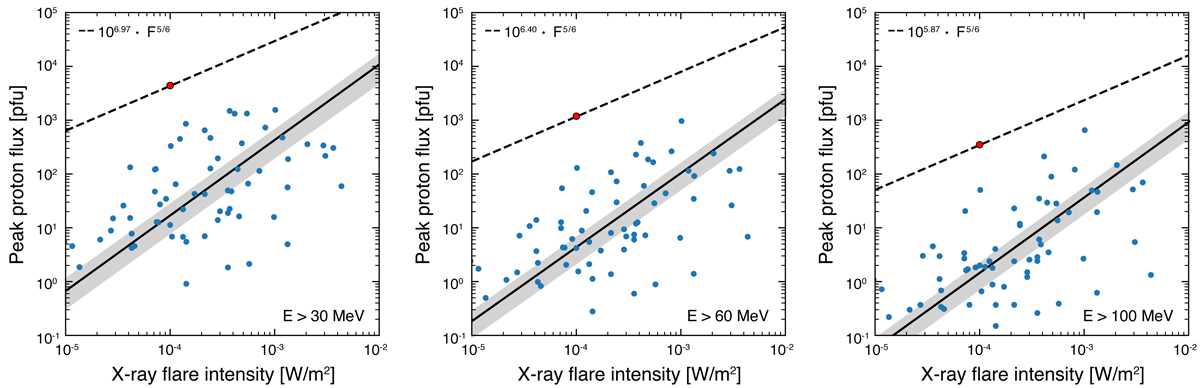
Similar to Fig. 1. From left to right, these panels present results for E > 30−; E > 60−; and E > 100 MeV, respectively. The solid black line corresponds to the RMA regression in each case. The black dashed line gives the upper solar limit based on the Takahashi et al. (2016) scaling law of ![]() . The line is forced to fit the uppermost point in each panel. In all panels, the red dot correspond to the 8 November 2000 outstanding large SEP event (see text for further details).
. The line is forced to fit the uppermost point in each panel. In all panels, the red dot correspond to the 8 November 2000 outstanding large SEP event (see text for further details).
Current usage metrics show cumulative count of Article Views (full-text article views including HTML views, PDF and ePub downloads, according to the available data) and Abstracts Views on Vision4Press platform.
Data correspond to usage on the plateform after 2015. The current usage metrics is available 48-96 hours after online publication and is updated daily on week days.
Initial download of the metrics may take a while.