Fig. B.1.
Download original image
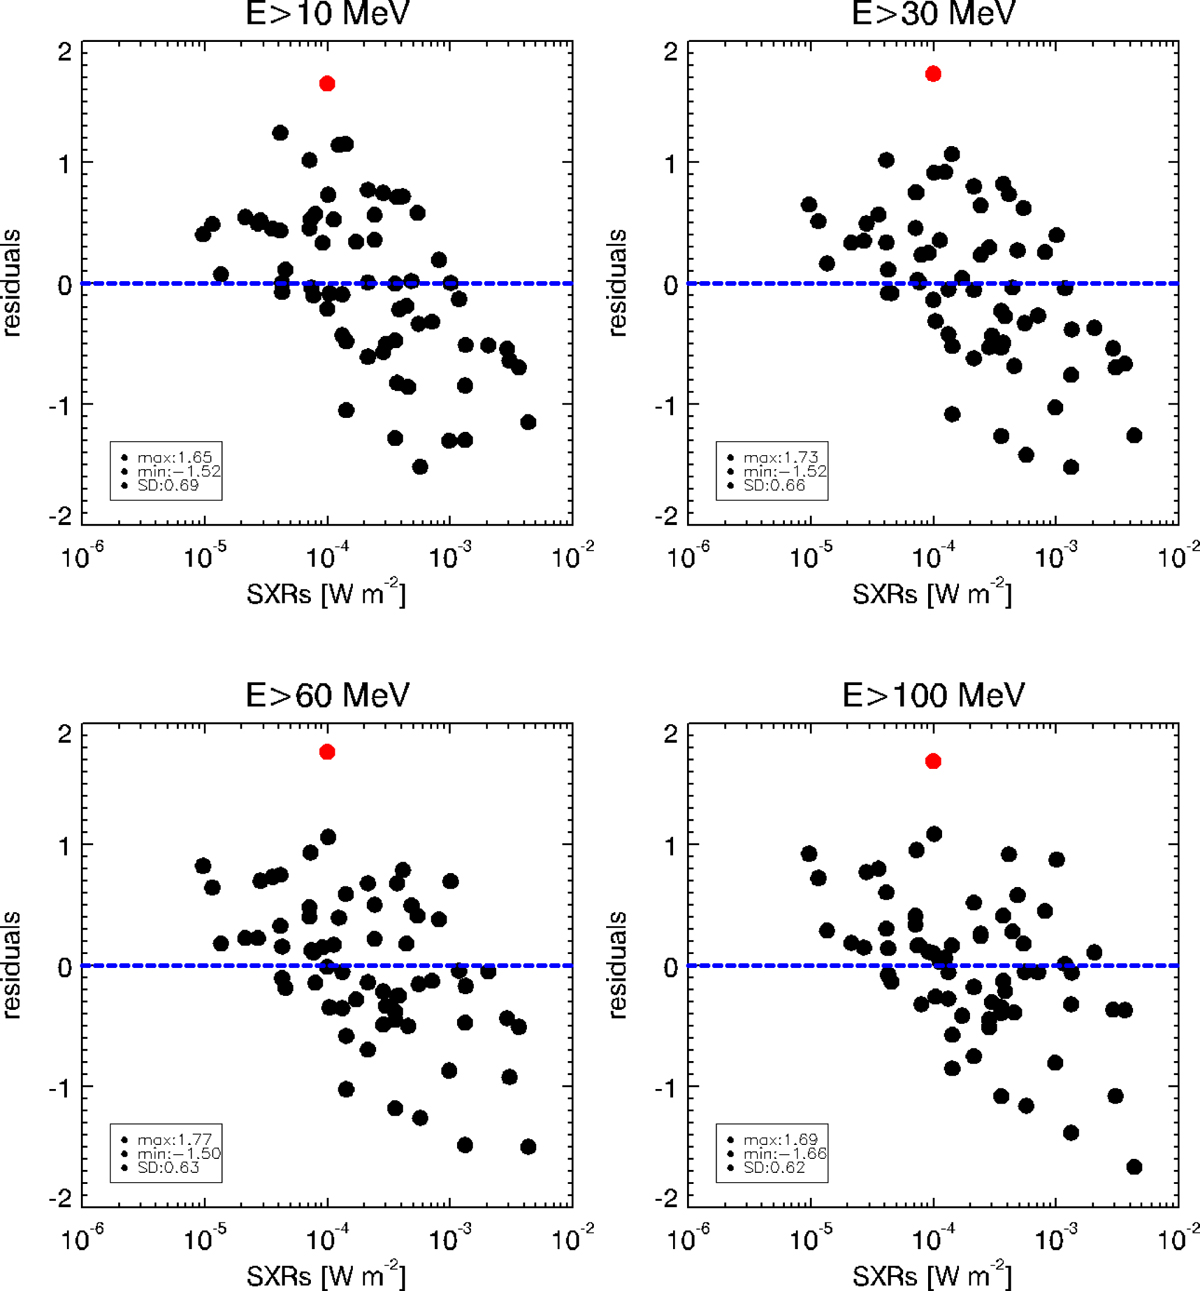
Calculated residuals vs. the SXR flux for all 65 events in our sample. Each panel corresponds to an integral energy (E> 10-; E> 30-; E> 60-; E> 100 MeV). In each panel the red point depicts the 8 November 2000 event. The legend provides the standard deviation of the residuals, as well as the minimum and the maximum residual of the sample.
Current usage metrics show cumulative count of Article Views (full-text article views including HTML views, PDF and ePub downloads, according to the available data) and Abstracts Views on Vision4Press platform.
Data correspond to usage on the plateform after 2015. The current usage metrics is available 48-96 hours after online publication and is updated daily on week days.
Initial download of the metrics may take a while.