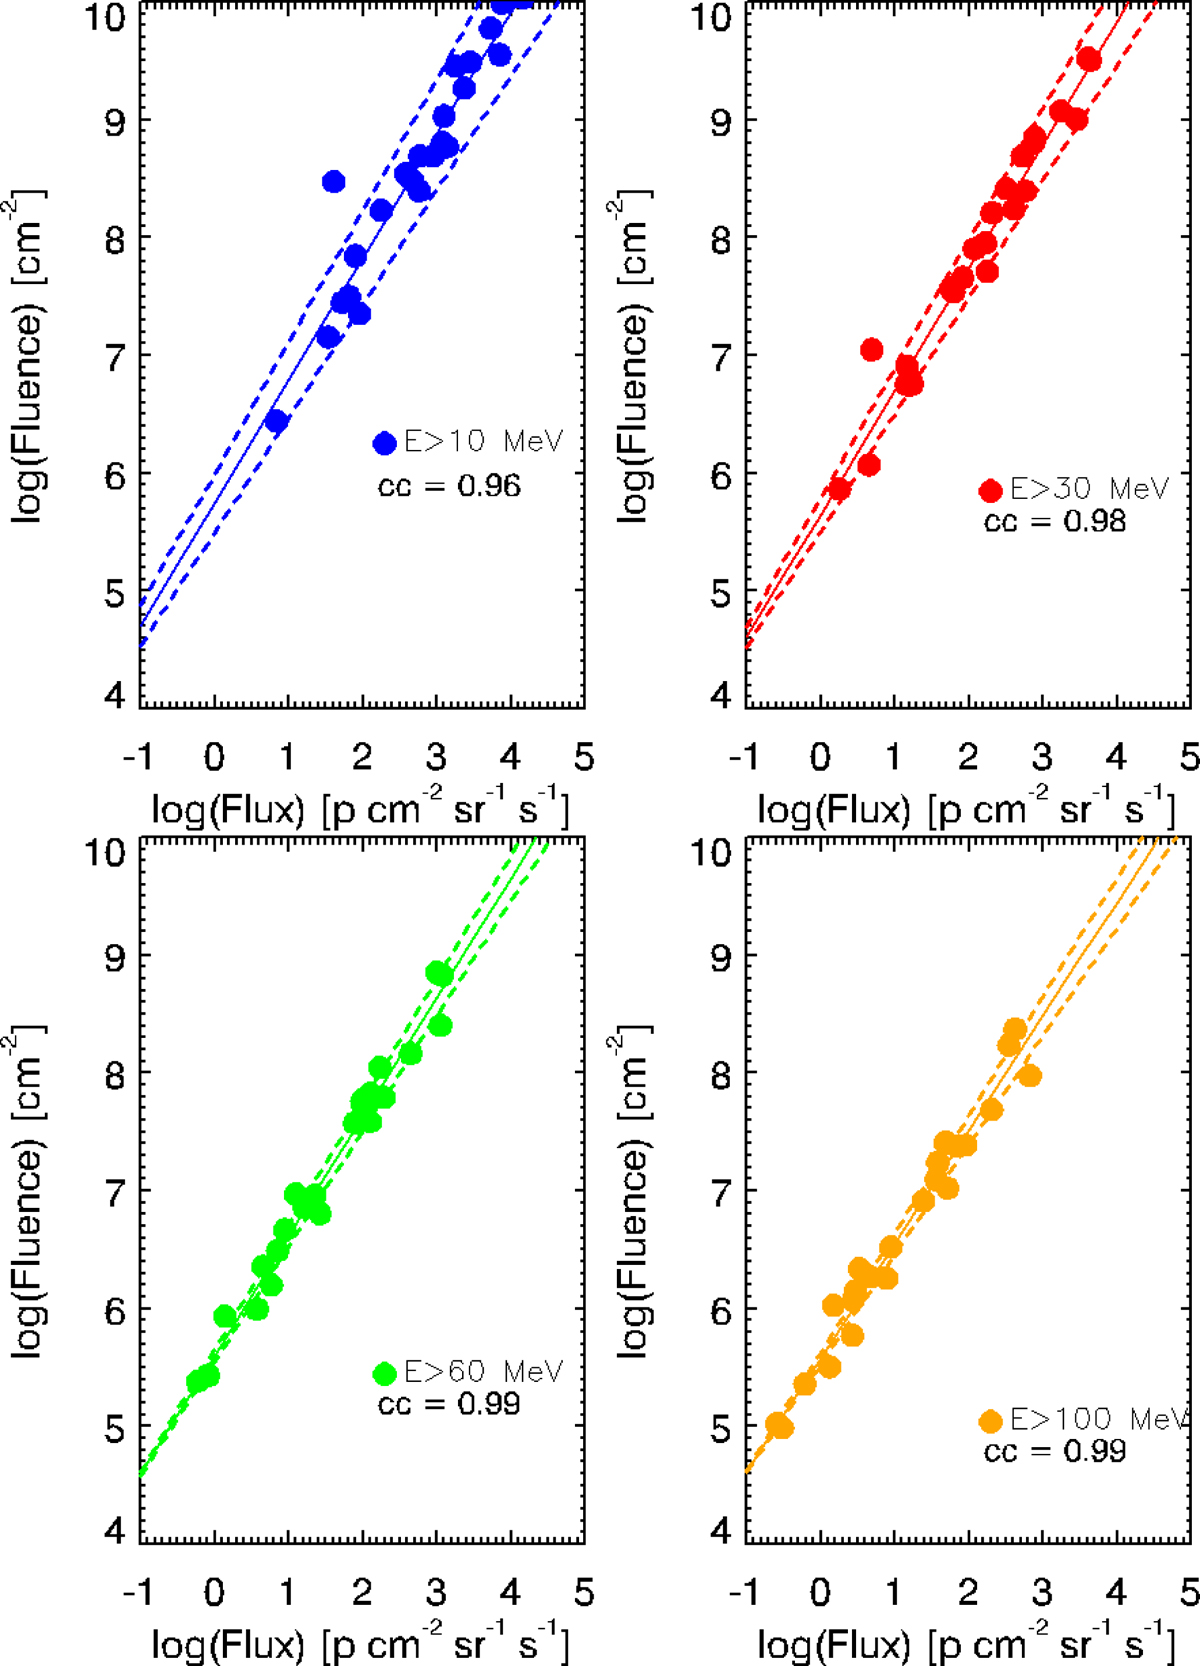
Fig. A.5.
Download original image
Similar to Figure A.1, but for annual values. Each integral energy is presented with a different color (E> 10 MeV - blue; E> 30 MeV - red; E> 60 MeV - green; and E> 100 MeV - orange). The obtained linear fit is depicted as a solid line in each panel, while the dotted lines give the 1σ error of the fit. The corresponding correlation coefficients (cc) are also presented in each plot.
Current usage metrics show cumulative count of Article Views (full-text article views including HTML views, PDF and ePub downloads, according to the available data) and Abstracts Views on Vision4Press platform.
Data correspond to usage on the plateform after 2015. The current usage metrics is available 48-96 hours after online publication and is updated daily on week days.
Initial download of the metrics may take a while.