Fig. A.4.
Download original image
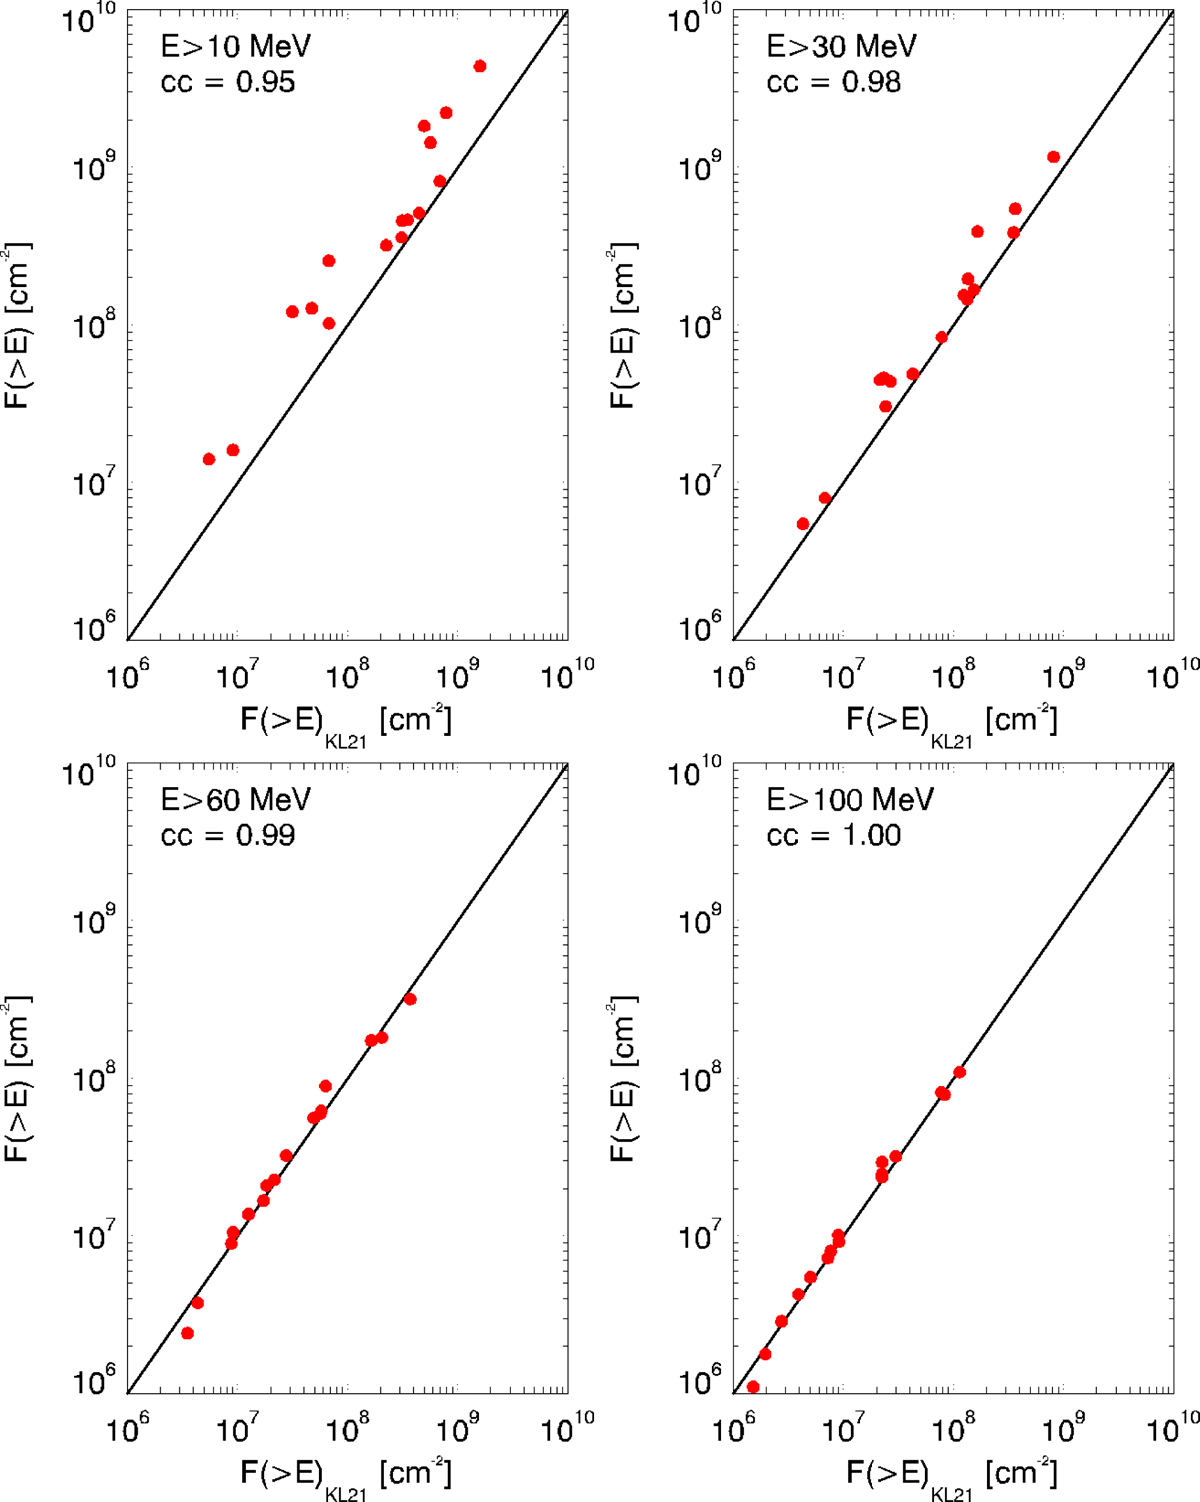
Similar to Figure A.3, but for scatter plots of the integral fluences F(> E) obtained from the data in this work (Y-axis) and from the work of KL21 (X-axis) for each integral energy of interest. The red circles correspond to individual GLE events (see Table A.3), and the solid black line denotes the diagonal dichotomous of each panel.
Current usage metrics show cumulative count of Article Views (full-text article views including HTML views, PDF and ePub downloads, according to the available data) and Abstracts Views on Vision4Press platform.
Data correspond to usage on the plateform after 2015. The current usage metrics is available 48-96 hours after online publication and is updated daily on week days.
Initial download of the metrics may take a while.