Open Access
Fig. A.2.
Download original image
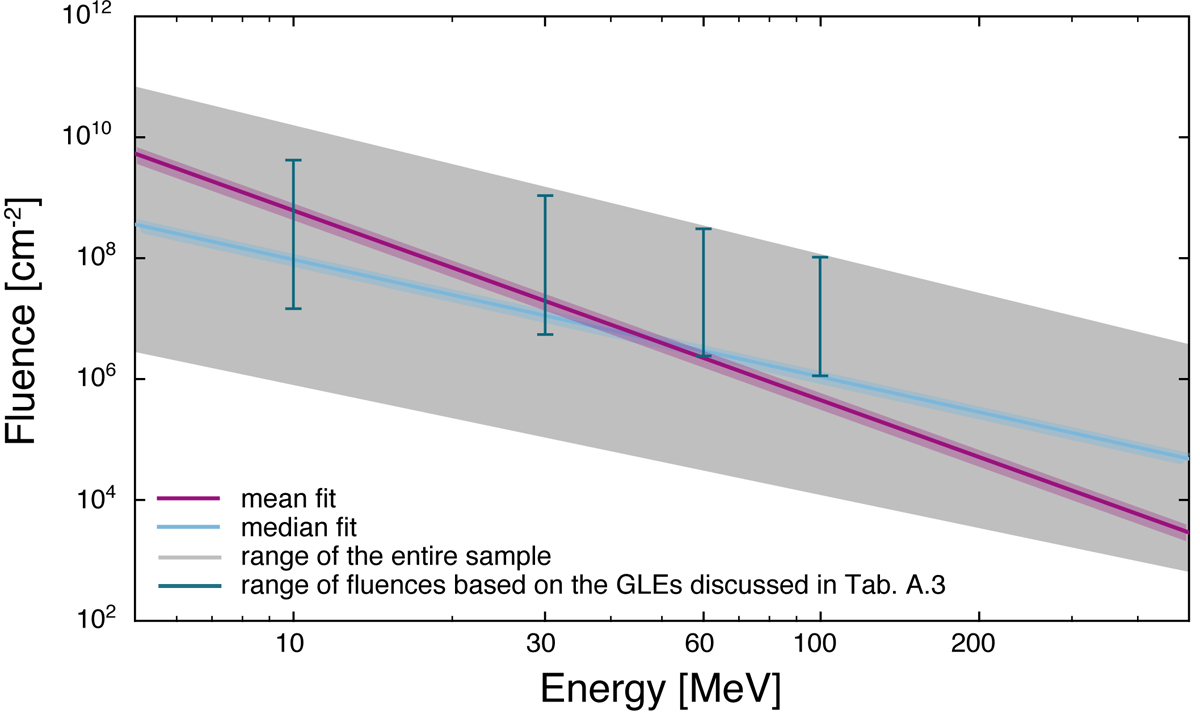
Similar to Figure 6. Here the range from the 65 SEP events is presented as a gray shaded area, the magenta line provides the mean, and the blue line represents the median spectrum from the measurements. The blue bars denote the range of the fluence at the respective integral energies from Table A.3.
Current usage metrics show cumulative count of Article Views (full-text article views including HTML views, PDF and ePub downloads, according to the available data) and Abstracts Views on Vision4Press platform.
Data correspond to usage on the plateform after 2015. The current usage metrics is available 48-96 hours after online publication and is updated daily on week days.
Initial download of the metrics may take a while.