Fig. 1.
Download original image
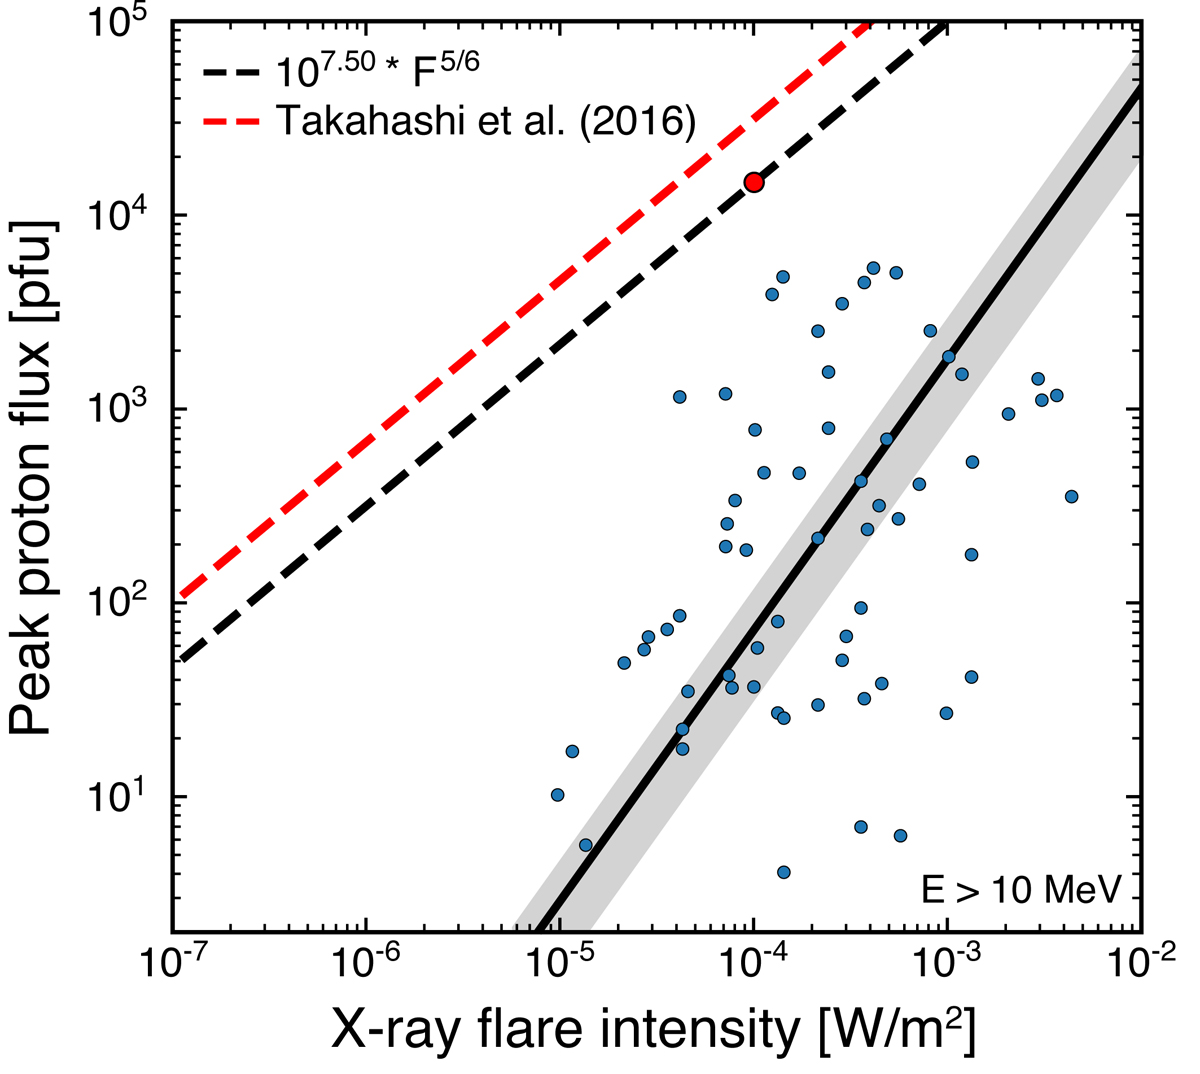
Scatter plot of the E > 10 MeV peak proton flux vs. the X-ray flare intensity of our new sample (blue dots). The solid black line corresponds to the RMA regression fit of our sample corresponding to ![]() with β = 1.40 ± 0.19. The red dashed line gives the upper solar limit from Takahashi et al. (2016) based on a scaling law of
with β = 1.40 ± 0.19. The red dashed line gives the upper solar limit from Takahashi et al. (2016) based on a scaling law of ![]() . In the figure, this relation was re-scaled to the upper-point in our sample presented as a red dot, suggesting a new upper limit that is slightly below the previously reported limit by Takahashi et al. (2016).
. In the figure, this relation was re-scaled to the upper-point in our sample presented as a red dot, suggesting a new upper limit that is slightly below the previously reported limit by Takahashi et al. (2016).
Current usage metrics show cumulative count of Article Views (full-text article views including HTML views, PDF and ePub downloads, according to the available data) and Abstracts Views on Vision4Press platform.
Data correspond to usage on the plateform after 2015. The current usage metrics is available 48-96 hours after online publication and is updated daily on week days.
Initial download of the metrics may take a while.