Fig. 7
Download original image
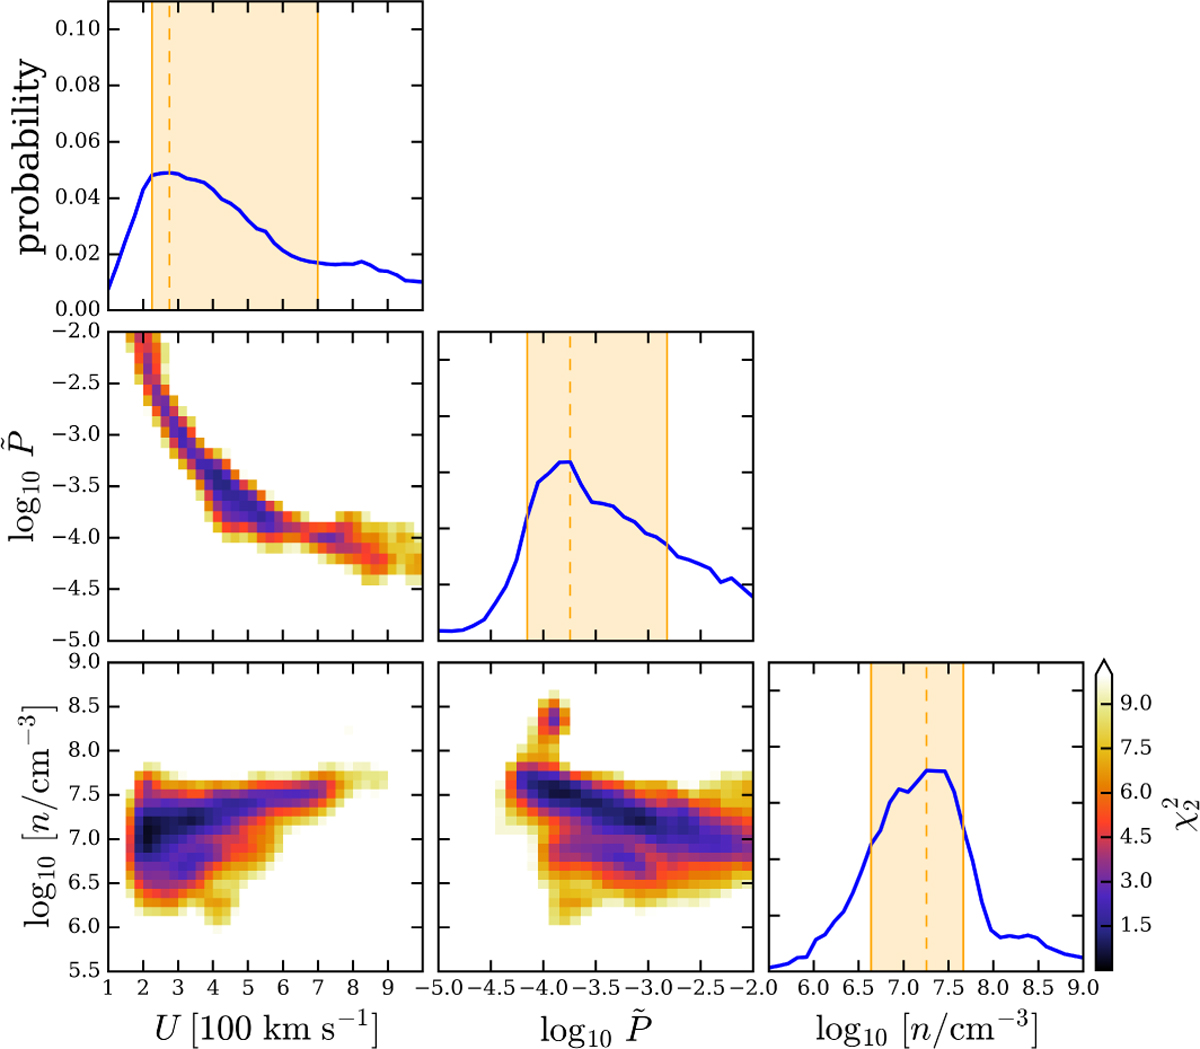
Corner plot of ![]() surface as a function of the model parameters for the case of pure geometrical dilution (δ = 2). Top panels in each column: probability density distributions for the marginalised parameters; confidence intervals (first and third quartiles) are shown as orange shaded rectangular regions, and the maximum-likelihood estimate is shown by a vertical dashed line.
surface as a function of the model parameters for the case of pure geometrical dilution (δ = 2). Top panels in each column: probability density distributions for the marginalised parameters; confidence intervals (first and third quartiles) are shown as orange shaded rectangular regions, and the maximum-likelihood estimate is shown by a vertical dashed line.
Current usage metrics show cumulative count of Article Views (full-text article views including HTML views, PDF and ePub downloads, according to the available data) and Abstracts Views on Vision4Press platform.
Data correspond to usage on the plateform after 2015. The current usage metrics is available 48-96 hours after online publication and is updated daily on week days.
Initial download of the metrics may take a while.