Fig. 6
Download original image
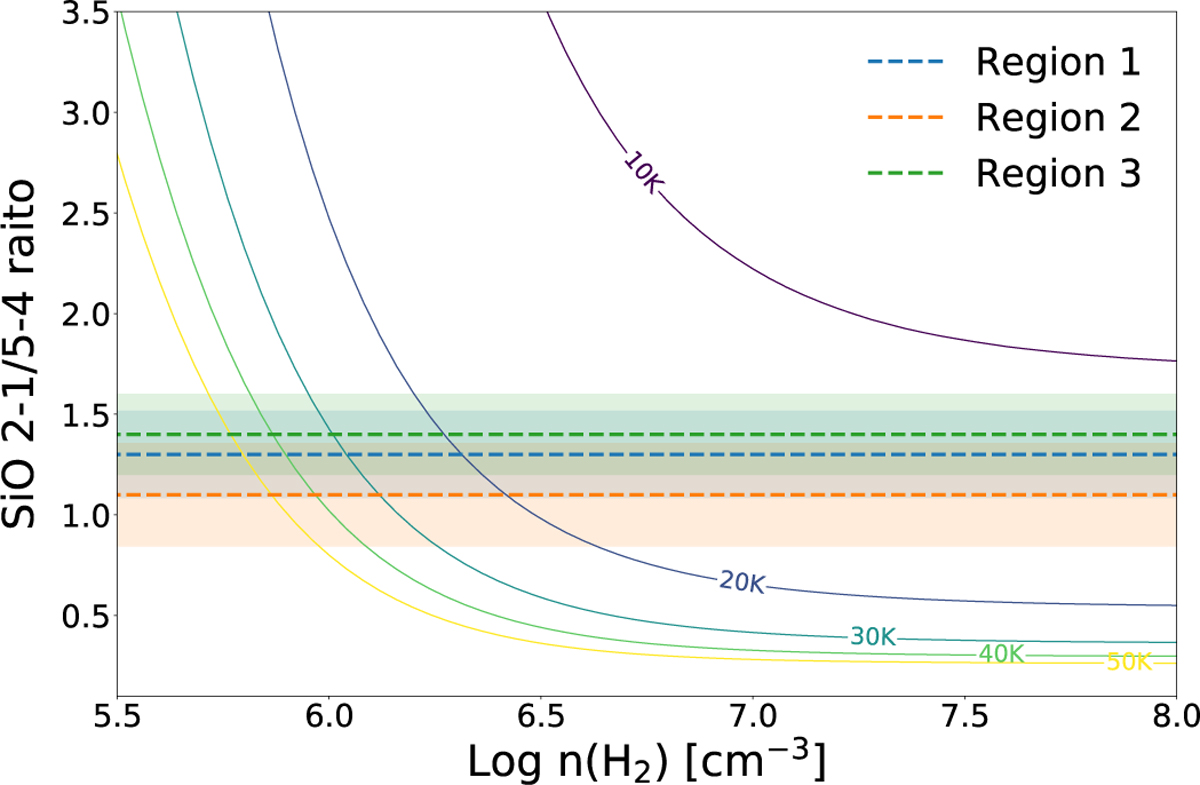
Non-LTE analysis of SiO emission lines. A series of RADEX models were run to estimate the kinetic temperature and density from the observed ratios of SiO J = 2−1 and J = 5−4 lines. Coloured dashed lines represent the ratio derived in the three regions highlighted in Fig. 1; the coloured shaded regions correspond to the error bars of the derived ratios, after assuming a 20% uncertainty on the peak brightness temperatures of each region. Solid curves represent the different temperatures obtained with the grid of models.
Current usage metrics show cumulative count of Article Views (full-text article views including HTML views, PDF and ePub downloads, according to the available data) and Abstracts Views on Vision4Press platform.
Data correspond to usage on the plateform after 2015. The current usage metrics is available 48-96 hours after online publication and is updated daily on week days.
Initial download of the metrics may take a while.