Fig. 2
Download original image
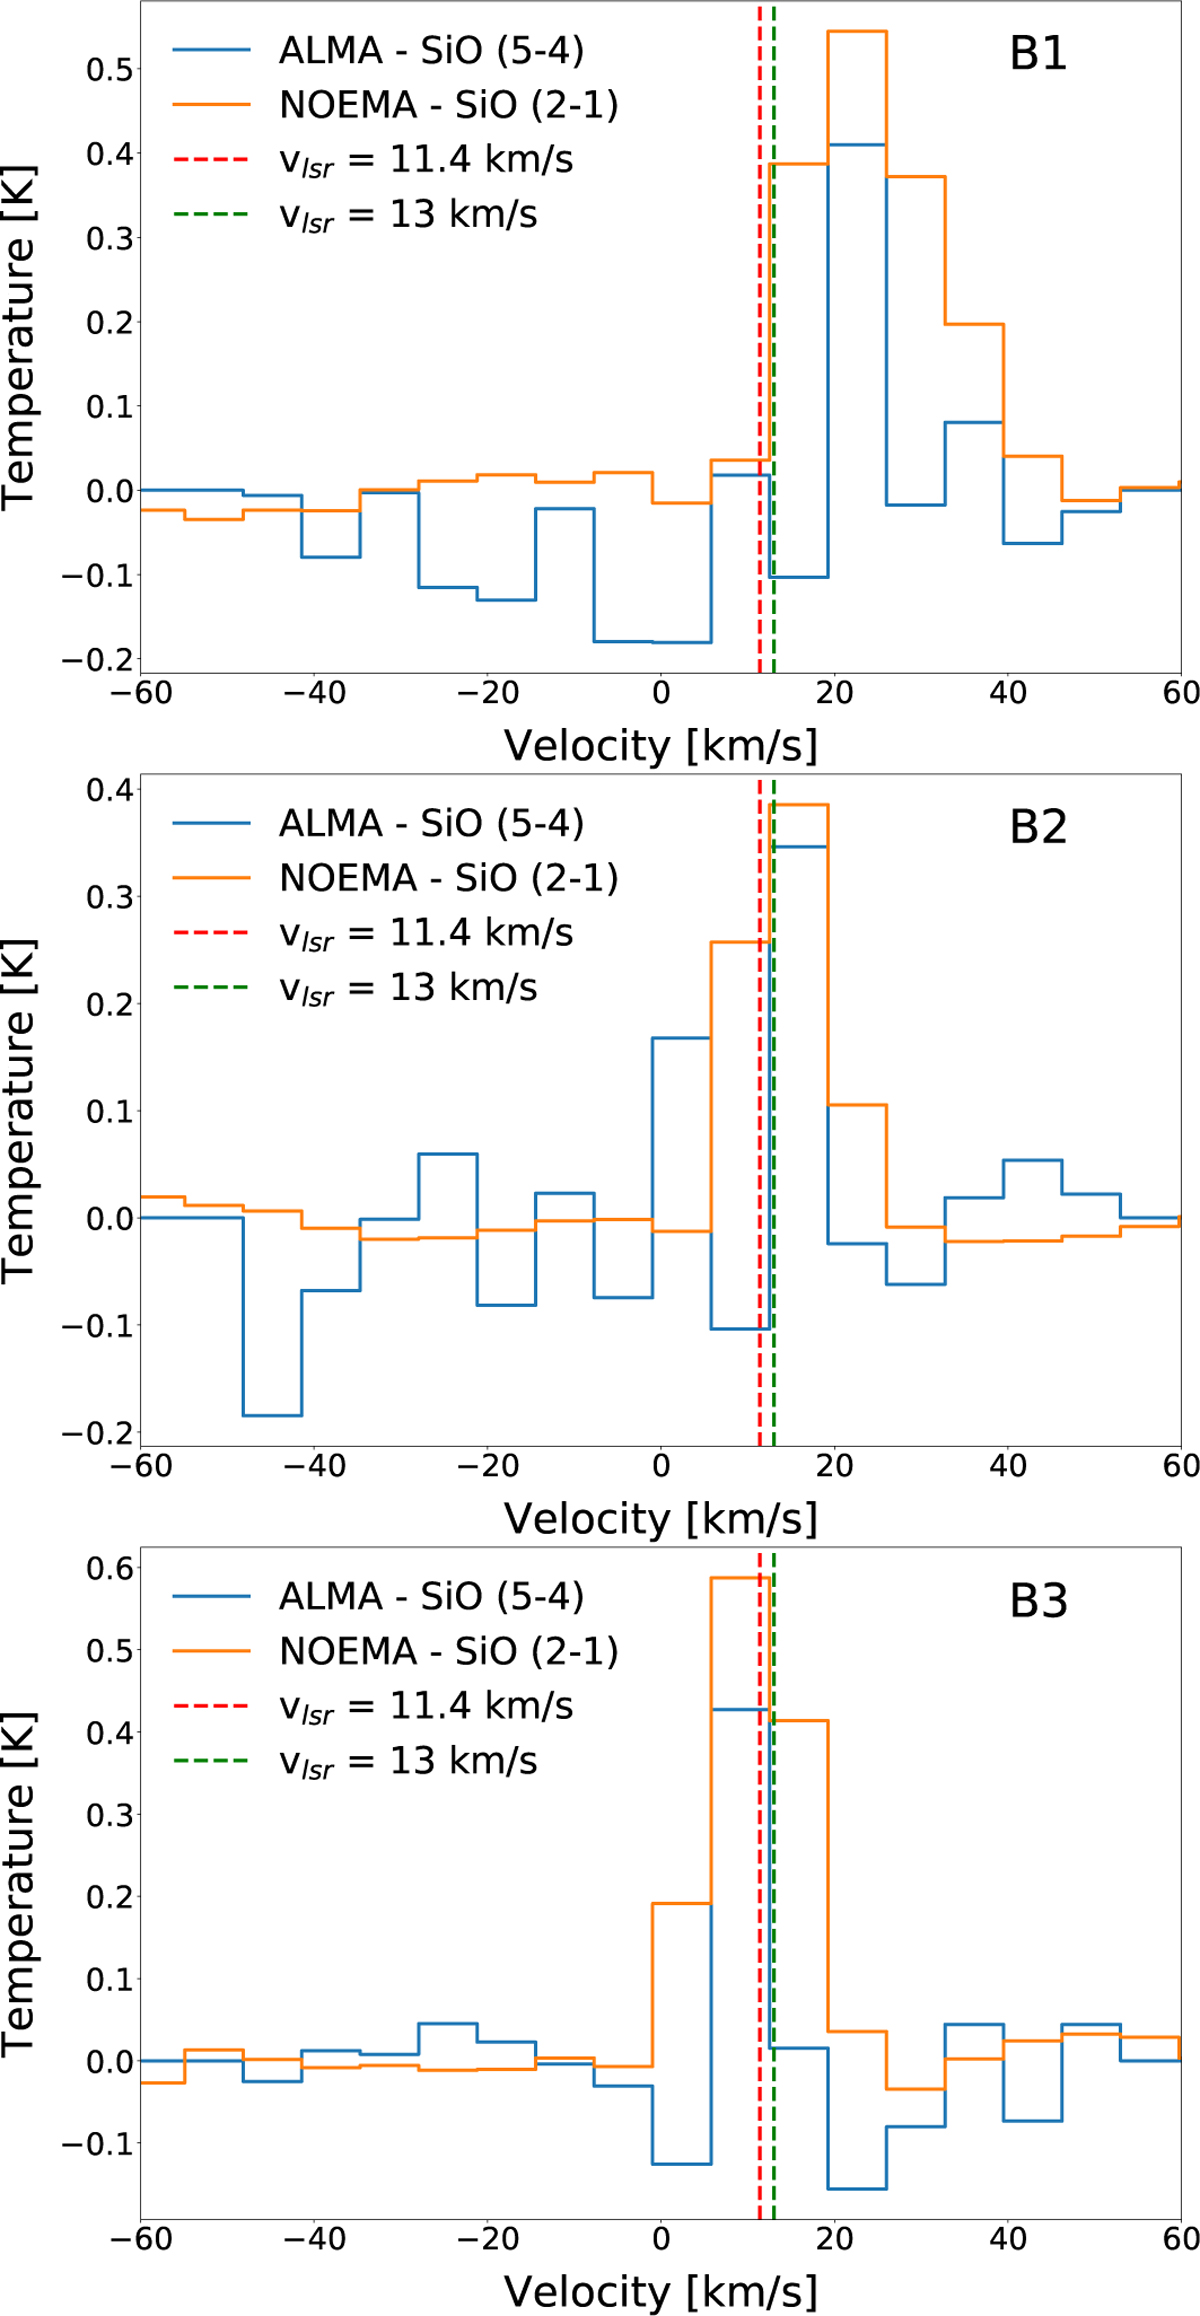
SiO emission line spectra extracted from the three regions described in Fig. 1. The red and green dashed vertical lines correspond to the systemic velocity of the FIR4 envelope and the protostar HOPS-108 at 11.4 and 13 km s−1, respectively. The ALMA spectra were obtained after performing a convolution of the ALMA beam with a Gaussian beam as large as the NOEMA angular resolution and regridding it to the same pixel size.
Current usage metrics show cumulative count of Article Views (full-text article views including HTML views, PDF and ePub downloads, according to the available data) and Abstracts Views on Vision4Press platform.
Data correspond to usage on the plateform after 2015. The current usage metrics is available 48-96 hours after online publication and is updated daily on week days.
Initial download of the metrics may take a while.