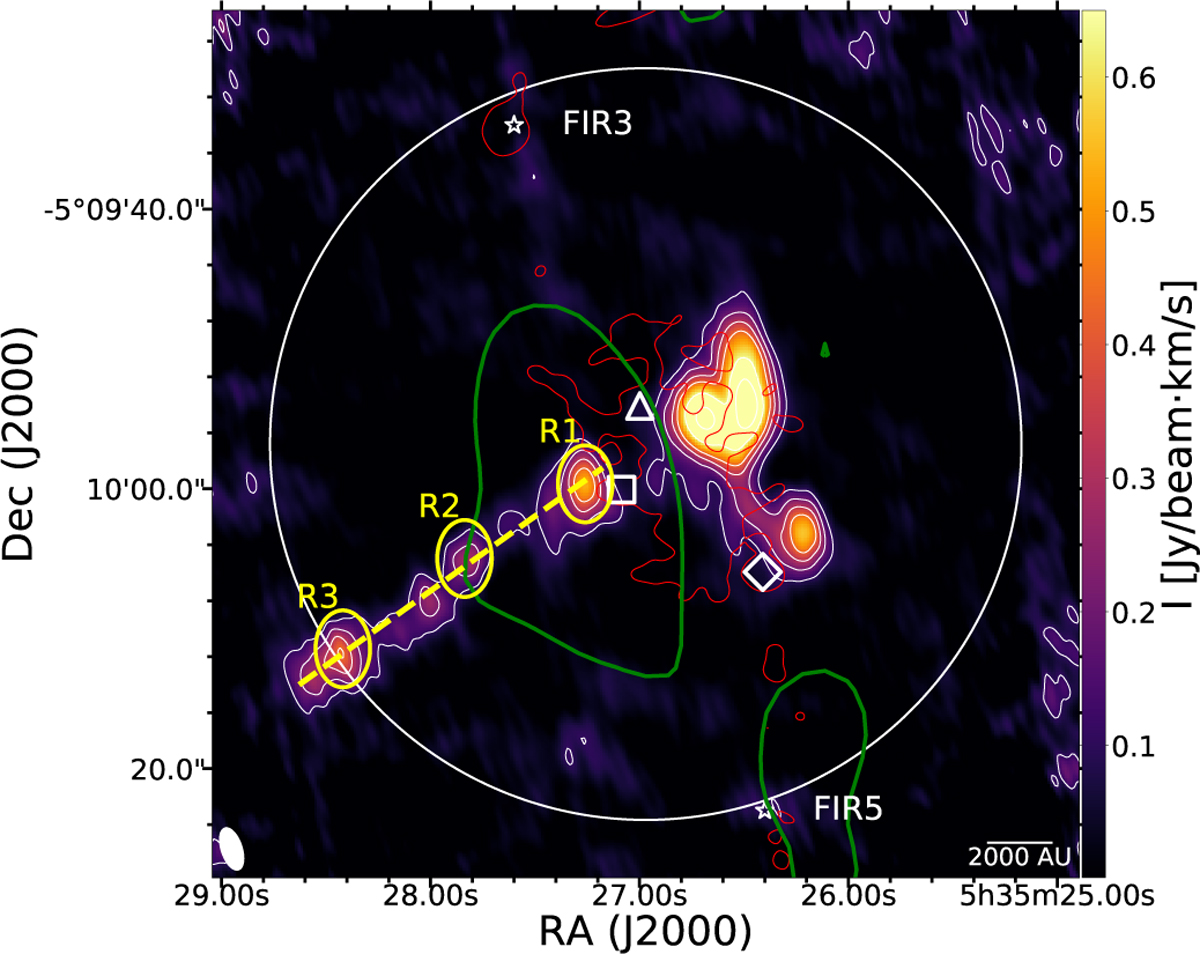
Fig. 1
Download original image
Integrated intensity (between −18 and 43 km s−1) map of the SiO (J = 2−1) emission towards OMC-2 FIR4; white contours are 10, 20, 30, 40, 60, and 80% of the maximum value (0.985 Jybeam−1 km s−1). The velocity channels were selected in the emission map with a 5σ cut-off around the emission peak (1σ = 6.7 × 10⁻⁴ Jy beam−1). Red contour indicates the 10σ of the 85 GHz continuum emission (Neri et al., in prep.; σ = 3.8 × 10⁻⁵ Jybeam−1). Green contour is the 7.5σ integrated emission of HC5N described in Fontani et al. (2017), with 1σ = 3.6 × 10⁻³Jybeam−1. km s−1. This region, with an average radius of ~ 5000 AU, is also where Fontani et al. (2017) inferred the CR ionisation rate of ζ = 4 × 10⁻¹⁴ s−1. The yellow open ellipses along the jet represent the three regions used to extract the spectra shown in Fig. 2 and are labelled R1, R2, and R3, while the yellow dashed line encompassing these three regions shows the cut used to generate the PV plot in Fig. 4. The three main protostars in FIR4, namely HOPS-108 (RA(J2000) = 05h35m27s.086, Dec(J2000) = −05°10′00″.06), HOPS-64 (RA(J2000) = 05h35m26s.998, Dec(J2000) = −05°09′54″.08), and VLA15 (RA(J2000) = 05h35m26.41, Dec(J2000) = −05°10′05″.94; Tobin et al. 2019), are represented by the three open symbols: square, triangle, and diamond, respectively. The white open circle marks the primary beam Full Width Half Maximum (FWHM) for the NOEMA observations. The bottom left ellipse represents the synthesised beam.
Current usage metrics show cumulative count of Article Views (full-text article views including HTML views, PDF and ePub downloads, according to the available data) and Abstracts Views on Vision4Press platform.
Data correspond to usage on the plateform after 2015. The current usage metrics is available 48-96 hours after online publication and is updated daily on week days.
Initial download of the metrics may take a while.