Fig. 1.
Download original image
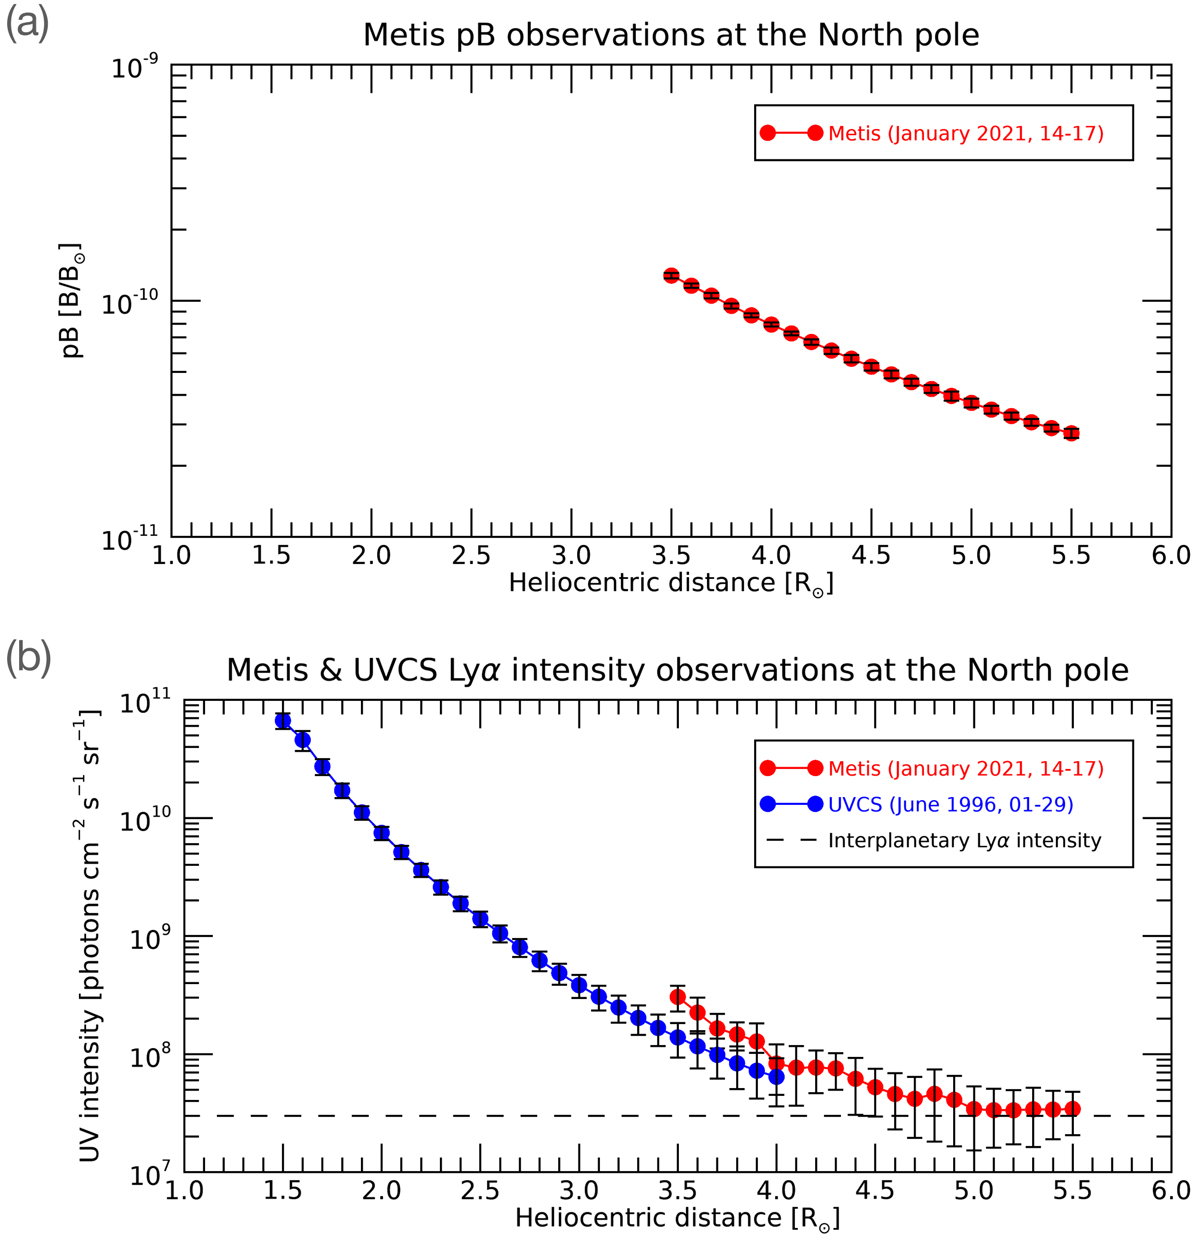
pB (a) and UV (b) radial profiles at the north polar coronal hole, as measured by Metis (red dots) and UVCS (blue dots). The horizontal dashed line indicates the interplanetary H I Lyα intensity.
Current usage metrics show cumulative count of Article Views (full-text article views including HTML views, PDF and ePub downloads, according to the available data) and Abstracts Views on Vision4Press platform.
Data correspond to usage on the plateform after 2015. The current usage metrics is available 48-96 hours after online publication and is updated daily on week days.
Initial download of the metrics may take a while.