Fig. 6
Download original image
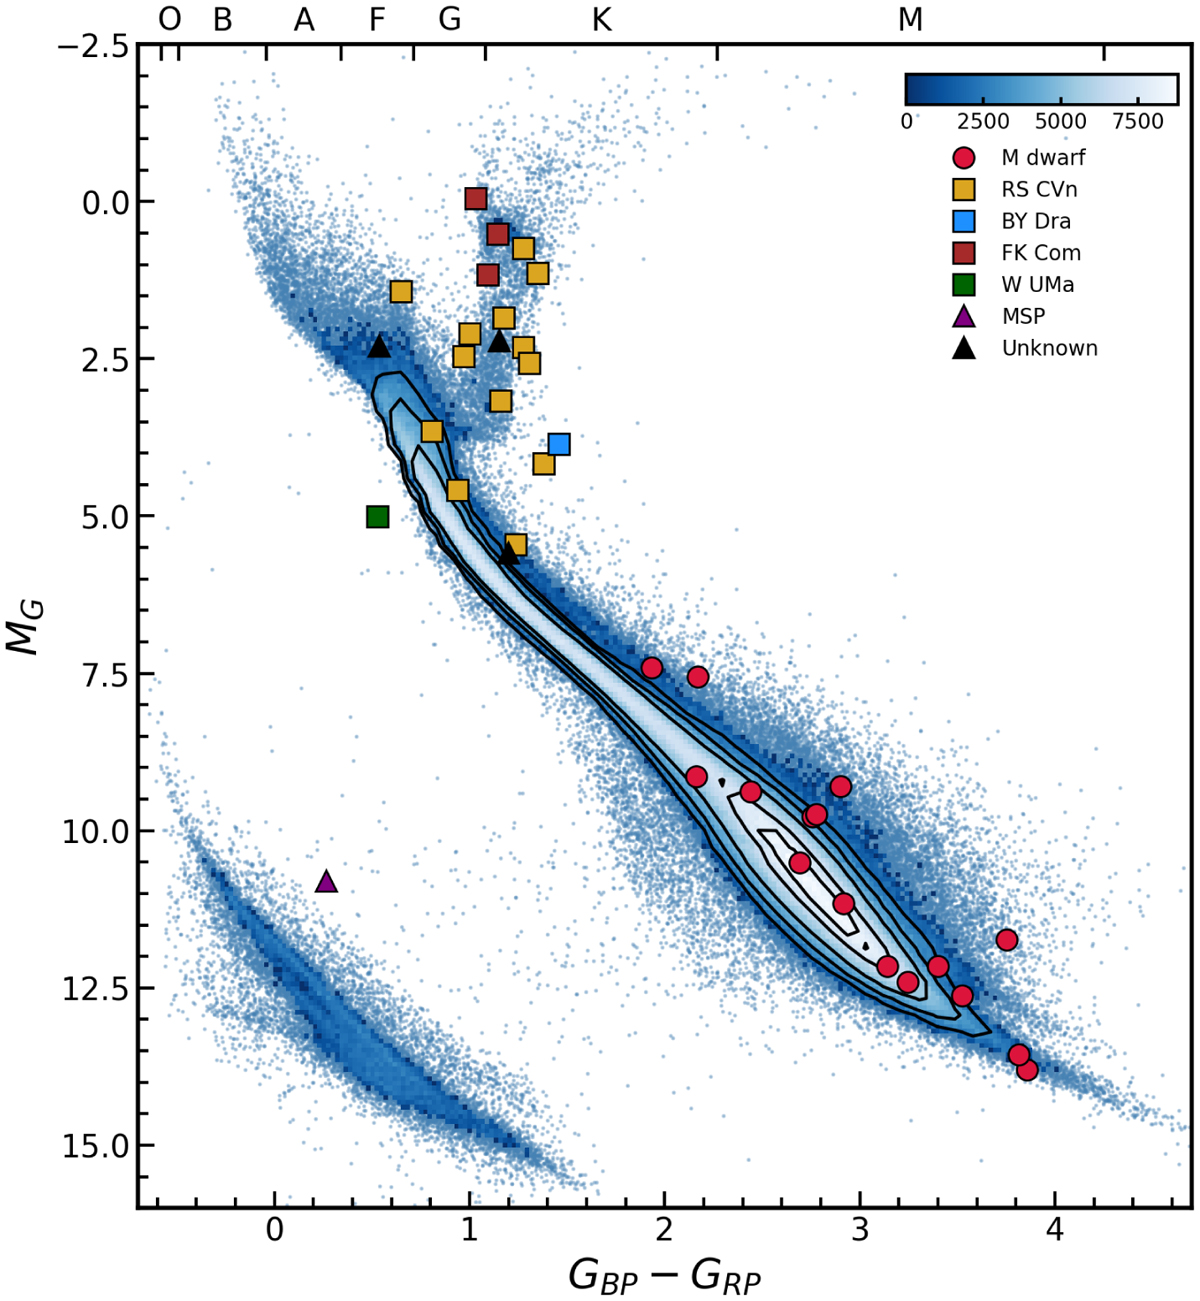
Hertzsprung-Russell diagram of sources in Gaia DR3 that are at ⩽150 pc (Gaia Collaboration 2018) and in the V-LoTSS survey footprint, with our Stokes V detections with Gaia DR3 counterparts overplotted. MG and GBP − GRP represent the absolute magnitude in the Gaia G-band and colour derived from the blue (BP) and red (RP) parts of the Gaia band, respectively. The colour bar in the upper-right corner represents the number of sources in the density plot. The top axis communicates the approximate ranges of different stellar spectral types. The colour of the overplotted points maps to the source class, as communicated in the legend. The source classes are M-dwarf (red circles), RS Canum Venaticorum (RS CVn; yellow squares), BY Draconis (BY Dra; blue squares), FK Comae Berenices (FK Com; brown squares), and W Ursae Majoris (W UMa; green squares) variable stars and millisecond pulsars (MSPs; purple triangle). We plot sources without a known class in the literature as black triangles.
Current usage metrics show cumulative count of Article Views (full-text article views including HTML views, PDF and ePub downloads, according to the available data) and Abstracts Views on Vision4Press platform.
Data correspond to usage on the plateform after 2015. The current usage metrics is available 48-96 hours after online publication and is updated daily on week days.
Initial download of the metrics may take a while.