Fig. 1
Download original image
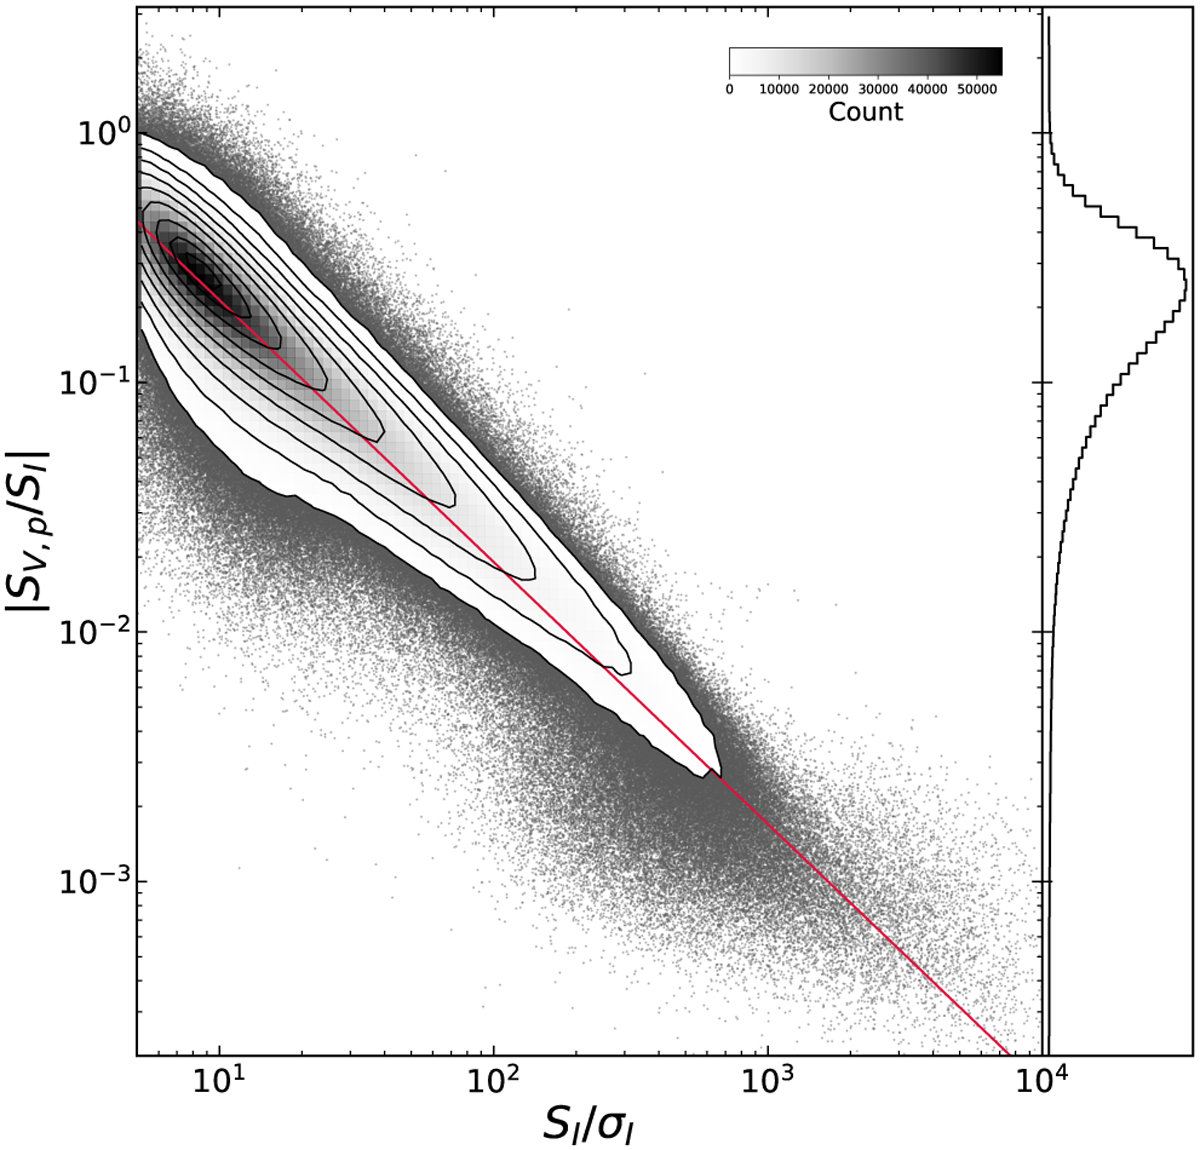
Absolute ratio of the maximum flux density of a Stokes V pixel, S V,p, to the total flux density of the corresponding Stokes I source, SI, as a function of signal-to-noise ratio, SI/σI, in Stokes I. The contours associated with the density plot correspond to 300, 900, 2500, 5000, 10 000, 20 000, 30 000, 40 000, and 50 000 measurements. The colour bar at the top-right-hand corner indicates the number of counts in the density plot. The red line is the trend measured when the aperture used to calculate the maximum Stokes V signal is replaced with Gaussian random noise. The simulation follows the measured data well up to SI/σI ~ 103, the point at which leakage becomes dominant. The histogram in the right panel shows the distribution of |SV,p/SI|, which is dominated by low signal-to-noise sources.
Current usage metrics show cumulative count of Article Views (full-text article views including HTML views, PDF and ePub downloads, according to the available data) and Abstracts Views on Vision4Press platform.
Data correspond to usage on the plateform after 2015. The current usage metrics is available 48-96 hours after online publication and is updated daily on week days.
Initial download of the metrics may take a while.